Shifts: Analysis of Renewable Energy Consumption Trends in the U.S.
DATA ANALYSIS | DATA VISUALIZATION

OVERVIEW
This project explores how renewable energy consumption in the United States has evolved over the past five decades. Drawing on extensive monthly consumption data between 1973 and 2023, the analysis examines how renewable sources have been integrated across different sectors and how their contributions have shifted over time.
The aim is to:
-
Identify key trends in renewable energy adoption across various sectors.
-
Analyze sectoral dependencies on renewable energy sources.
-
Examine compositional shifts in the types of renewable energy consumed.
-
Understand the state of clean energy adoption in the U.S. and how it has changed over time.
RESEARCH QUESTION
How has the composition and sectoral distribution of renewable energy consumption in the U.S. evolved over the past fifty years, and what trends reveal patterns of adoption across different sectors?
PROCESS
The data analysis was conducted using grouped data by year, month, and sector. Visualizations were created to identify long-term sector-specific trends and breakdowns by renewable energy source type.
DATA SOURCES
SOFTWARE
R Studio, MS Excel and Tableau.
GENERAL ANALYSIS
The data encompassed the usage of 13 unique renewable energy sources across five sectors: commercial, electric power, industrial, residential, and transportation, tracked monthly for each year from 1973 to 2023.
The energy consumption in the visualizations is represented "in trillion BTUs" or British Thermal Units. In the context of renewable energy, a trillion BTUs represents a large amount of energy, commonly used to quantify the energy produced or consumed by renewable sources such as solar, wind, and hydropower.
Sectors

Renewable Energy Sources

What does each of these sectors potentially include in terms of usage?
-
Electric Power: Energy used for generating electricity, primarily from renewable sources like wind, solar, hydroelectric, and biomass.
-
Commercial: Energy consumption in businesses, offices, retail stores, and public buildings for lighting, heating, cooling, and equipment.
-
Industrial: Energy used by manufacturing and production industries for machinery, processing, and large-scale operations.
-
Residential: Energy consumed in homes for heating, cooling, lighting, appliances, and other household needs.
-
Transportation: Energy used in vehicles, including cars, trucks, trains, and airplanes, with a focus on fuels like biofuels and electricity for electric vehicles.
Figure 1.0 presents an area map showing the sector-wise distribution of energy across the five sectors from 1973 to 2023. The data reveals a generally steady increase in the adoption of renewable energy across sectors. Notably, the electric power sector shows the sharpest growth, while the other sectors have experienced more uniform adoption rates.
Interestingly, after a somewhat steep incline in 80's, the residential sector appears to have a surprising decline in renewable energy adoption over time. Given the current state of global warming and the increase in weather-related events in recent years, one might expect higher adoption of renewable energy in the residential sector. However, the data reveals otherwise, showing a lack of significant growth in residential adoption.

Figure 1.0 [Click image to view interactive visualization]
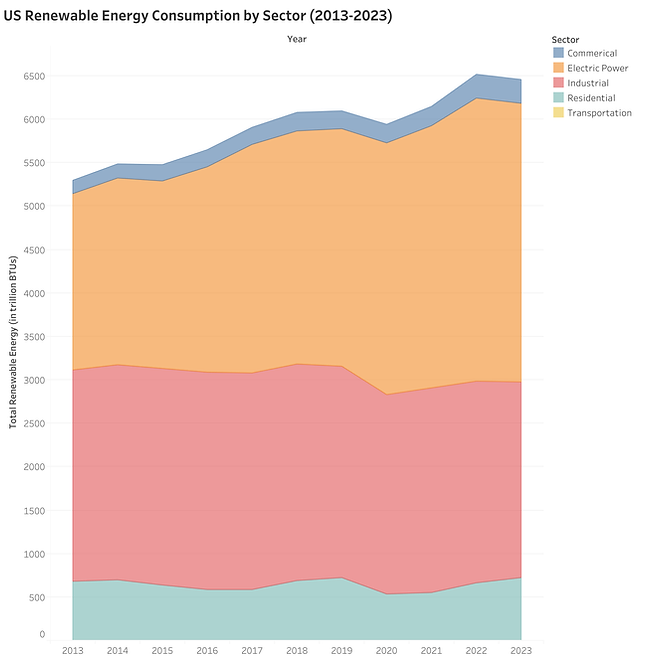
Figures 2.1 and 2.2 present area charts showing renewable energy consumption for the first decade of the dataset (1973-1983) and the last decade (2013-2023), respectively. This comparison allows us to assess the growth in renewable energy consumption over the initial decade and observe the volume of increase in the most recent decade more clearly.
.png)
Figure 2.1 [Click image to view interactive visualization]
.png)
Figure 2.2 [Click image to view interactive visualization]
If you haven’t already noticed, let’s address the elephant in the room: there is no data representation for the transportation sector in these visualizations. While the data isn’t perfect and contains several missing values, I imagine the absence of transportation data entirely is not solely due to the issue of missing values.
The transportation sector has the least adoption of renewable energy sources: over 90% of the transportation sector currently relies on oil. For instance, air travel, a significant part of this sector, is almost entirely run on fossil fuels, primarily kerosene.
SECTORAL CONSUMPTION TRENDS

Figure 3.0
Figure 3.0 above shows a scatter plot of total renewable energy consumption across sectors from 1973 to 2023 over each month in a given year, hence the multiple dots in a given year.
The electric power sector dominates renewable energy usage, displaying a pronounced upward trend starting from the mid-2000s. This reflects the significant investment in large-scale solar and wind energy projects over the past two decades.
The industrial sector also shows steady growth, although at a slower rate. Residential and commercial sectors remain relatively flat, showing marginal increases, while transportation exhibits consistently low adoption, mirroring the broader energy challenges within that sector.
Interestingly, even as renewable energy sources have become more accessible and affordable, the residential sector's growth remains modest, possibly reflecting infrastructure and policy barriers to widespread adoption in homes.
SECTOR ADOPTION TRENDS
Figure 4.0 below provides a closer look at the sector-wise distribution of renewable energy consumption in 10-year intervals. We observe a marginal increase in adoption rates from the 1980s to the early 2010s, followed by a steep rise in some sectors in the last decade. Here’s a brief sector-wise analysis:
-
Commercial: Adoption starts low compared to other sectors and remains relatively stagnant, showing minimal increase.
-
Electric: This sector sees generally high adoption, with steady growth and a significant surge in the last decade, surpassing even industrial adoption, which is higher in all other year groups.
-
Industrial: Begins with the highest consumption and shows steady growth, with a large jump in the last decade as well.
-
Residential: As noted earlier, residential adoption declines after the early 1990s but has picked up again in the past decade.
-
Transportation: There is no data for this sector, but with accurate reporting, we may have seen a growing increase due to the rise in popularity of electric vehicles in the last few years.
%20(1).png)
Figure 4.0 [Click image to view interactive visualization]
SEASONAL ENERGY TRENDS
Figure 5.0 presents a sector-wise analysis of renewable energy consumption, averaged monthly from 1973 to 2023, aiming to identify notable trends. The data is fairly straightforward, with no significant shifts observed across months.
Sector-wise consumption remains consistent, and overall consumption is stable. December, January, and March show higher consumption, likely due to increased heating demand in cold weather, while May to July sees a slight uptick, probably due to cooling needs in the summer.
However, none of these fluctuations stand out significantly, as the consumption levels in other months are relatively close.

Figure 5.0 [Click image to view interactive visualization]
RENEWABLE ENERGY SOURCE TRENDS
Figure 6.0 below presents individual trend lines for each of the 13 renewable energy sources. Since the data begins in 1973, we see that biomass energy [sky blue], wood energy [light pink], and conventional hydroelectric power [pale peach] had high adoption from the start. This is likely due to their use long before the dataset was collected.
We can also observe the widespread adoption of newer renewable sources like solar and wind, which only began to expand in use and widespread adoption post the 2000s, as shown in the visualization.
(There are multiple lines representing the 13 renewable energy sources in this chart. For better clarity on each individual source and its trend, I highly recommend viewing the interactive visualization by clicking on the image.)

Figure 6.0 [Click image to view interactive visualization]
Notably, biomass energy has maintained the steepest upward trajectory in adoption, while wood energy is trending downward, likely due to the availability of more efficient and advanced renewable sources and greater migration and expansion to urban settings that don't necessarily rely on wood energy as for power needs. Consumption of conventional hydroelectric power remains stable with no shifts through the decades.
The steep increases in consumption that can be seen after 2000s are particularly evident in renewable sources like ethanol fuel [green], biomass losses [dark orange], wind energy [plum], and solar energy [pink]. These trends reflect the growing expansion and installation of solar and wind farms across the United States in recent years.
Ethanol and biomass losses are particularly significant because they represent byproducts of other processes: biomass losses result from biomass energy production, and ethanol is derived from fermenting plant materials like grains and sugar cane.
This highlights the efficient use of byproducts from renewable energy sources, emphasizing technological progress in minimizing waste and maximizing the efficiency of renewable energy systems for a more sustainable future.
FUTURE DIRECTIONS
The data reveals promising renewable energy growth, especially in electric power, but also highlights gaps in the residential and transportation sectors.
Looking ahead, integrating policy analysis will help clarify how incentives, regulations, and technology are shaping this progress — and whether renewables can scale fast enough to meet rising energy demand.
Future research into the transportation sector, particularly with the rise of electric vehicles, will offer a more complete picture of how renewables are transforming one of the most fossil-fuel-dependent domains.