Civic tech · Product design strategy
Census outreach infrastructure, rebuilt for the people who run the count
Product design strategy for CUNY's Hard-to-Count Map 2030: research-backed priorities, information architecture, and a map workspace field teams can actually use.
10 stakeholder interviews
11 peer maps audited
12-week engagement
Strategy adopted by CUNY
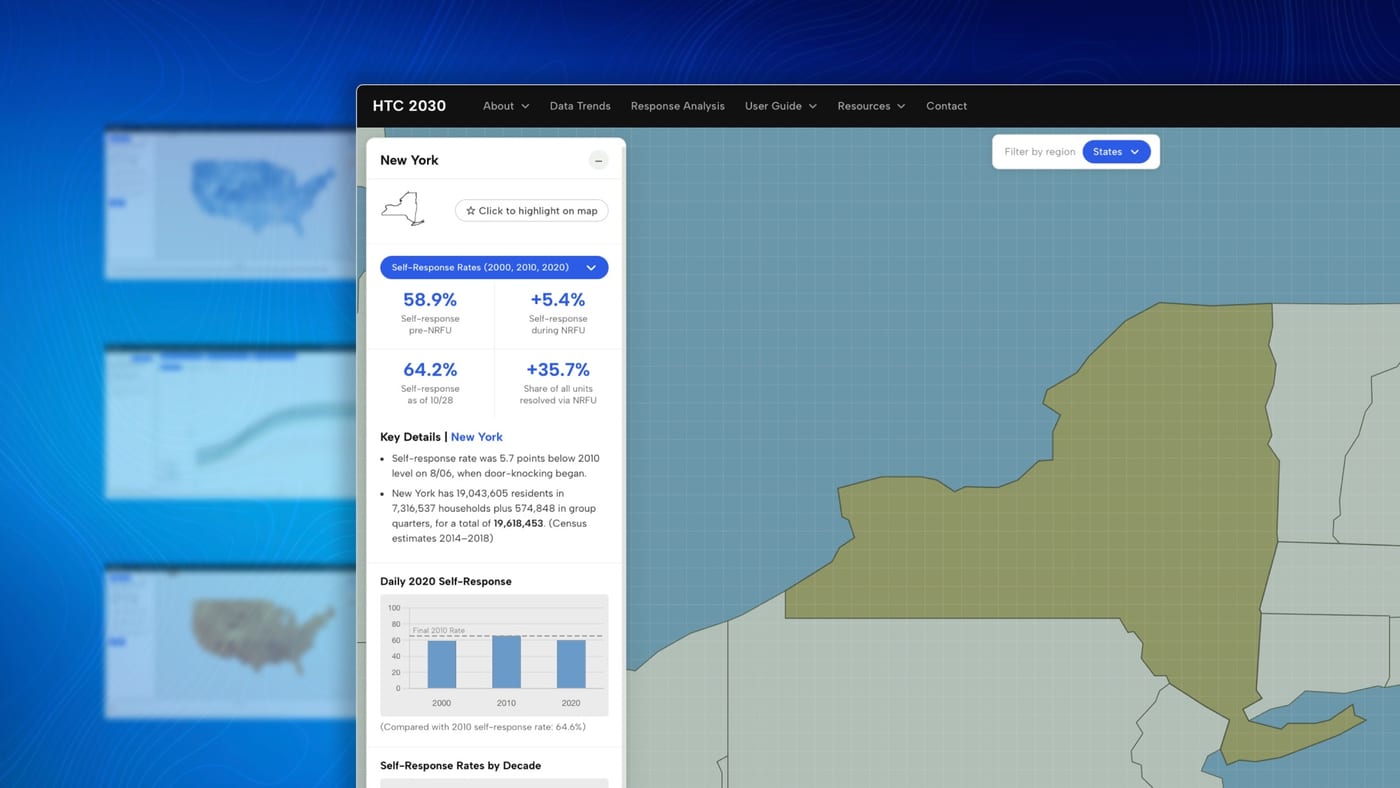
I led product design strategy with CUNY Mapping Service, turning field research into committed priorities and a UI system now guiding the next HTC Map build.
- Client
- Center for Urban Research, CUNY Mapping Service
- Role
- Product design strategy lead
- Team
- 4 designers · strategy and workshop lead
- Scope
- Research → prioritization → IA → proposed UI
The adoption gap
High-stakes census data.Low field usability.
Undercounted communities lose housing, healthcare, and representation for a decade. CUNY's Hard-to-Count Map finds risk, but the 2020 product made it hard for the people funding and running outreach to act in time.
Operational risk
Single-layer filters
Multi-layer field needs sat behind one-dimensional controls. Teams left the product to plan.
Workflow gap
Export out of reach
Workers needed lists and reports for partners on the ground. Files were hard to find and share.
Adoption barrier
Built for GIS experts
Dense chrome locked out funders and organizers who coordinate the outreach the map exists for.
The job wasn't a prettier map. Keep census-grade density without making the product unusable for the people who fund and run outreach.
What this engagement delivered
A strategy and UI system for Census 2030 outreach
Research-backed product direction: prioritized IA, accessibility foundations for engineering, and a map dashboard built around layering, export, and first-session onboarding.
26+
Interface states designed
10
Stakeholder interviews
11
Peer products audited
4
Product systems redesigned
Evidence to direction
What the field said became what we built first
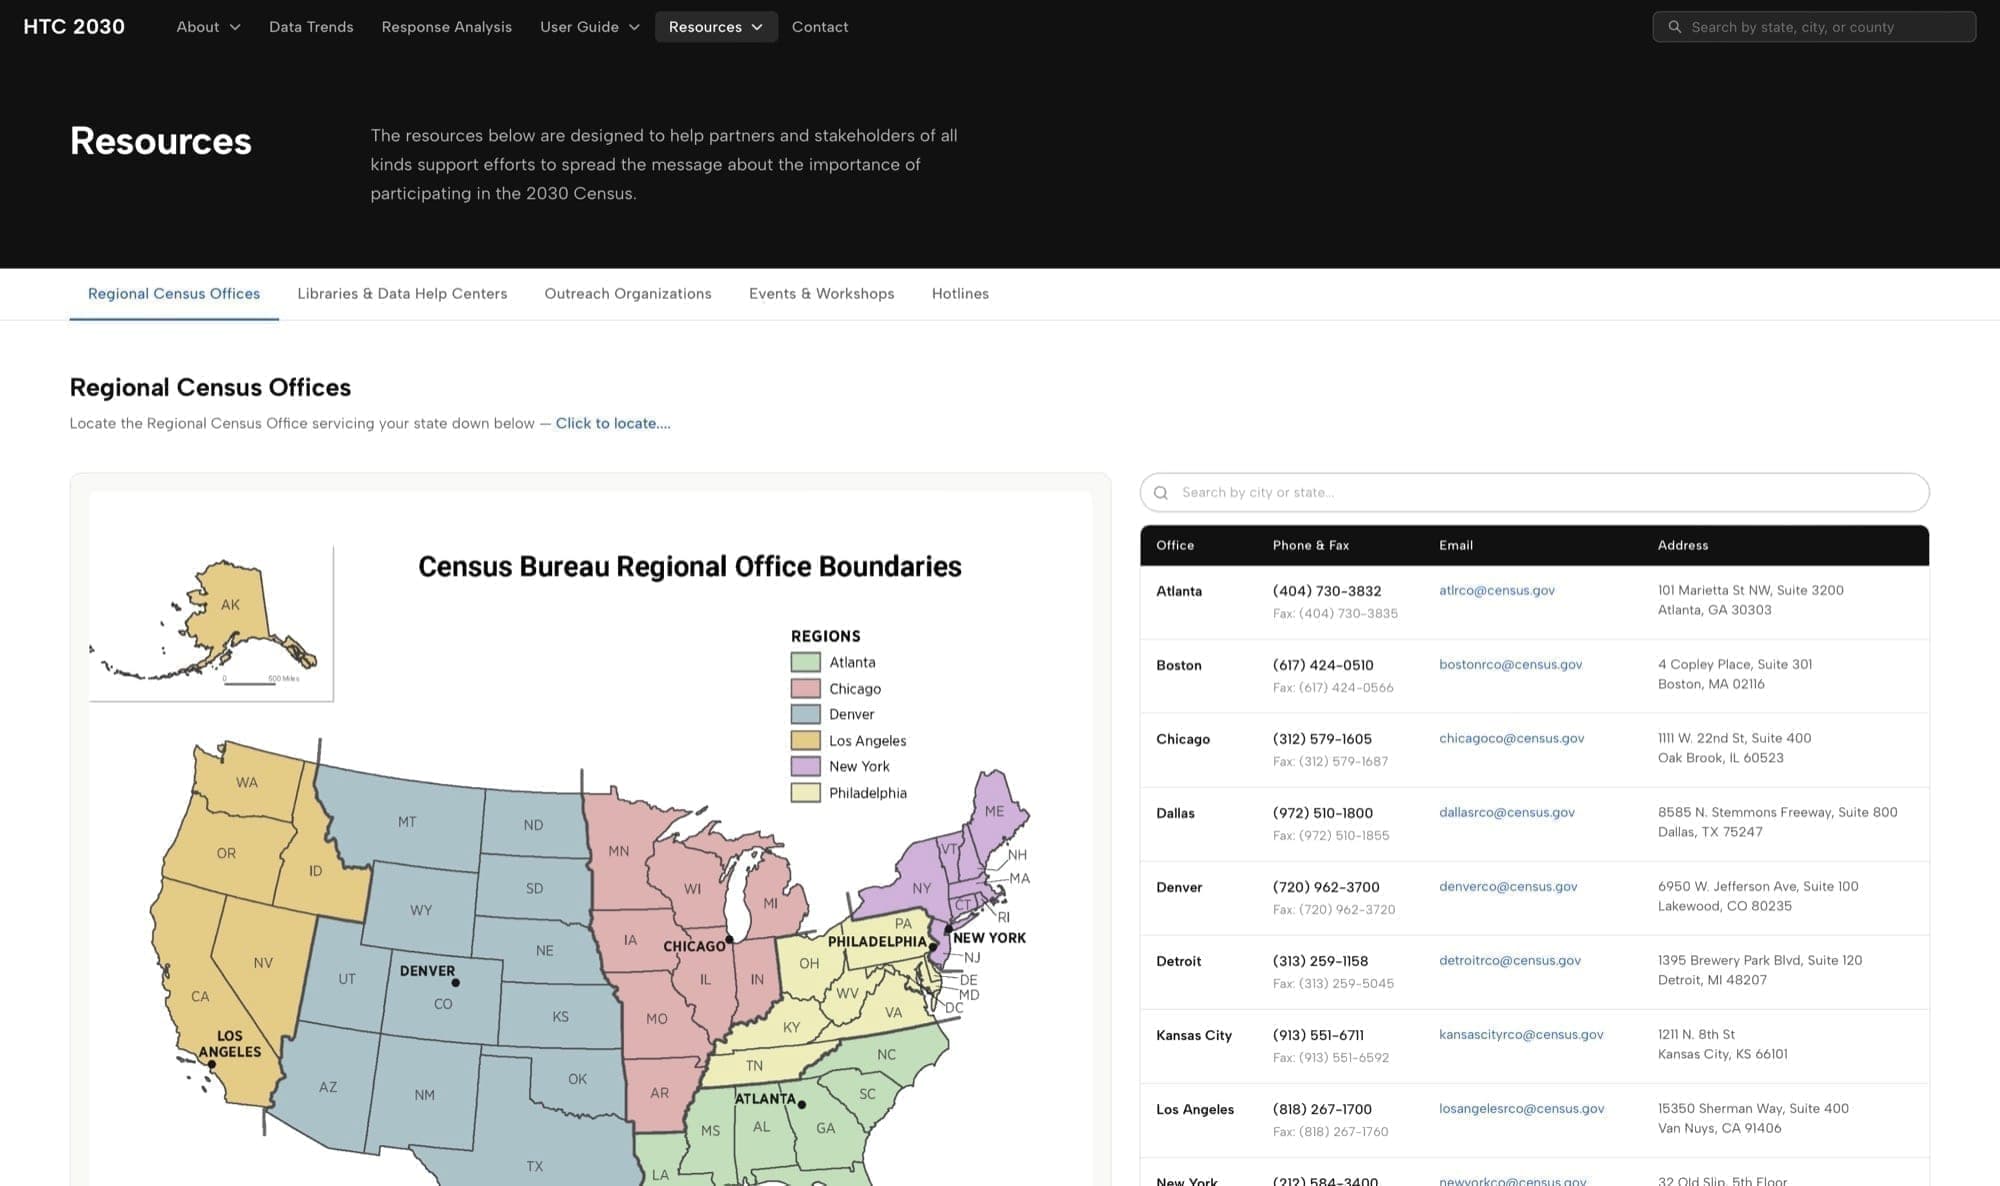
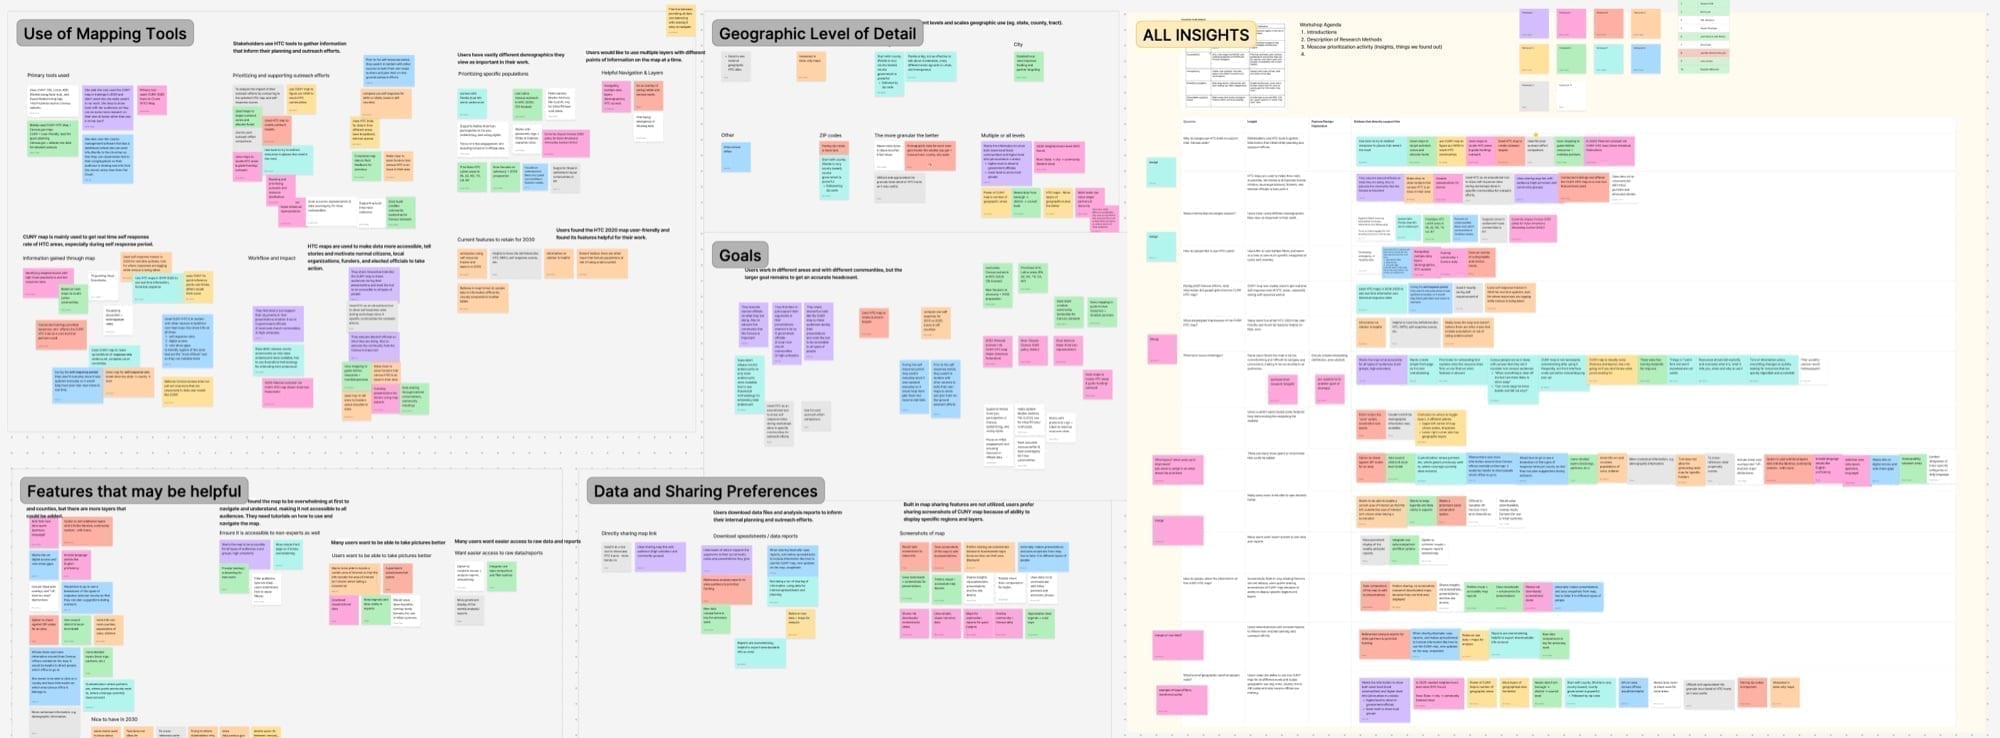
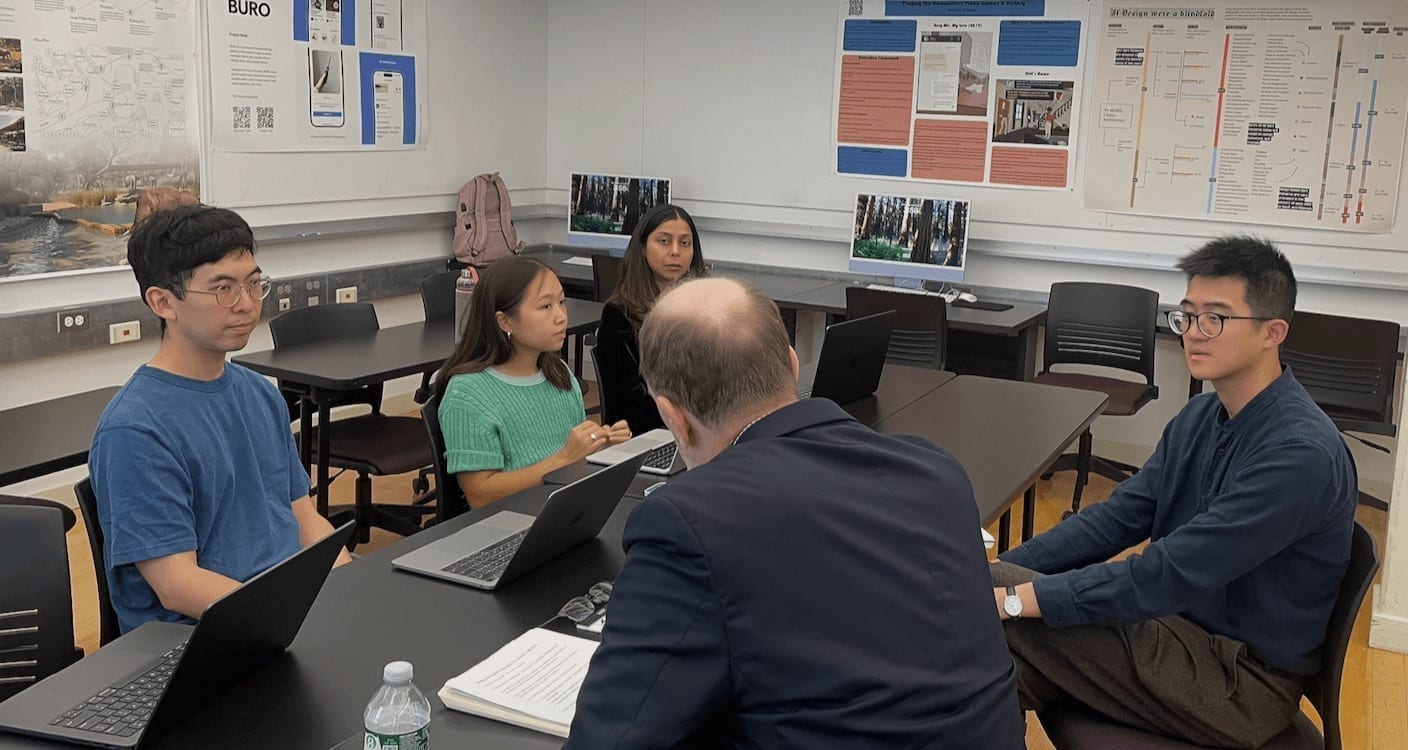
Audited the 2020 product, compared 11 peer maps, and interviewed 10 U.S. stakeholders already using HTC so the next version ships the right work first.
Field signal
Product must-have
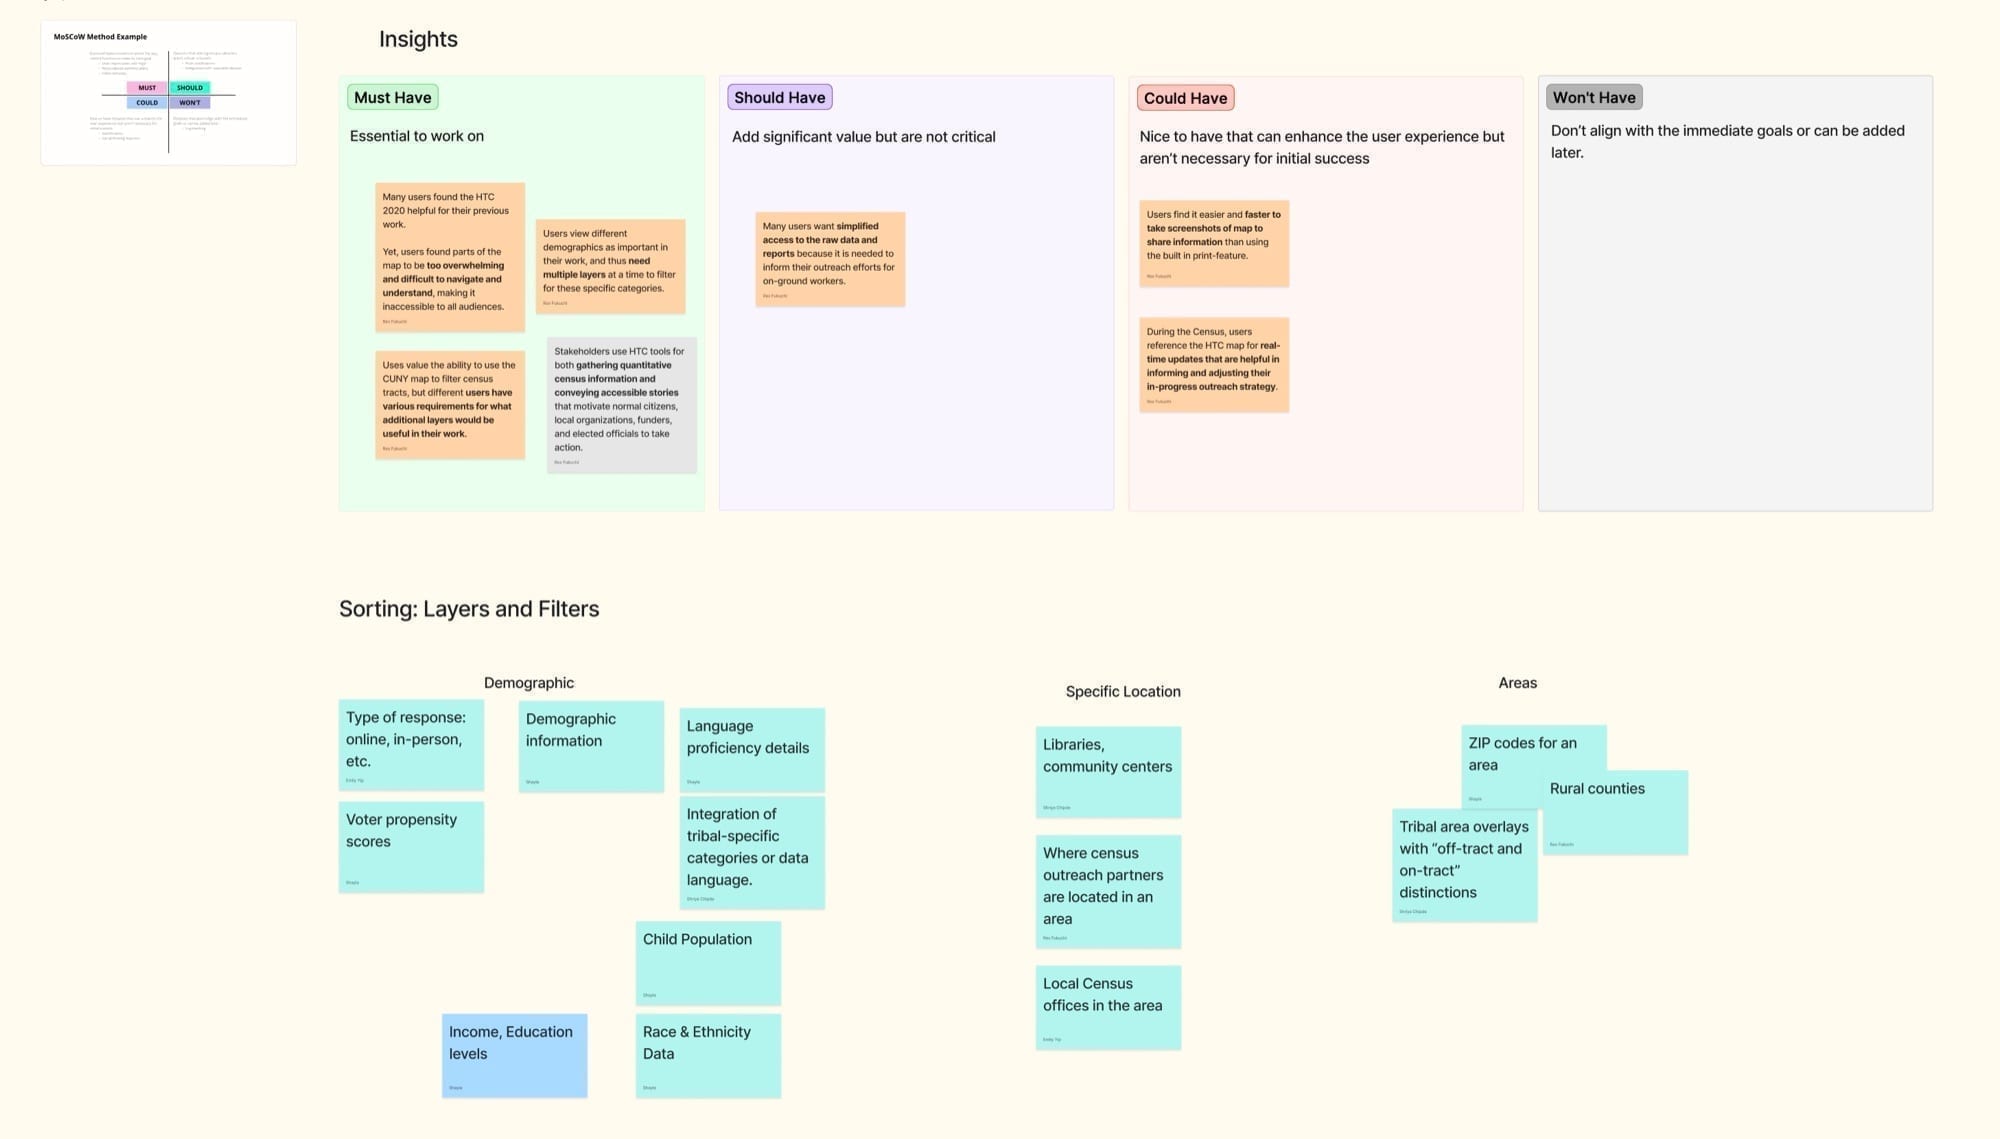
Outreach never cares about one demographic alone
Must-have
Multi-layer filtering
Workers need lists and reports offline for partners
Must-have
Export and share on the map surface
Non-GIS funders stall in dense controls
Must-have
Onboarding and clear IA first
Strategy
Three priorities that held scope
MoSCoW with CUNY turned research into a committed design focus, not an infinite backlog of polite ideas.
01
Layers for field decisions
Stackable demographics and clearer filters so teams answer "who is hard to count here?" without leaving the map.
02
Transferable outputs
Share, print, and reports on the map itself. Insights that stay in-browser do not fund outreach.
03
Widen access first
Onboarding, user guide, and IA that separates map work from content so funders can participate.
Product systems
The lifecycle of a field decision, before and after
Foundations and wayfinding first, then map depth, then supporting content. Each surface earns priority by how often outreach teams touch it.
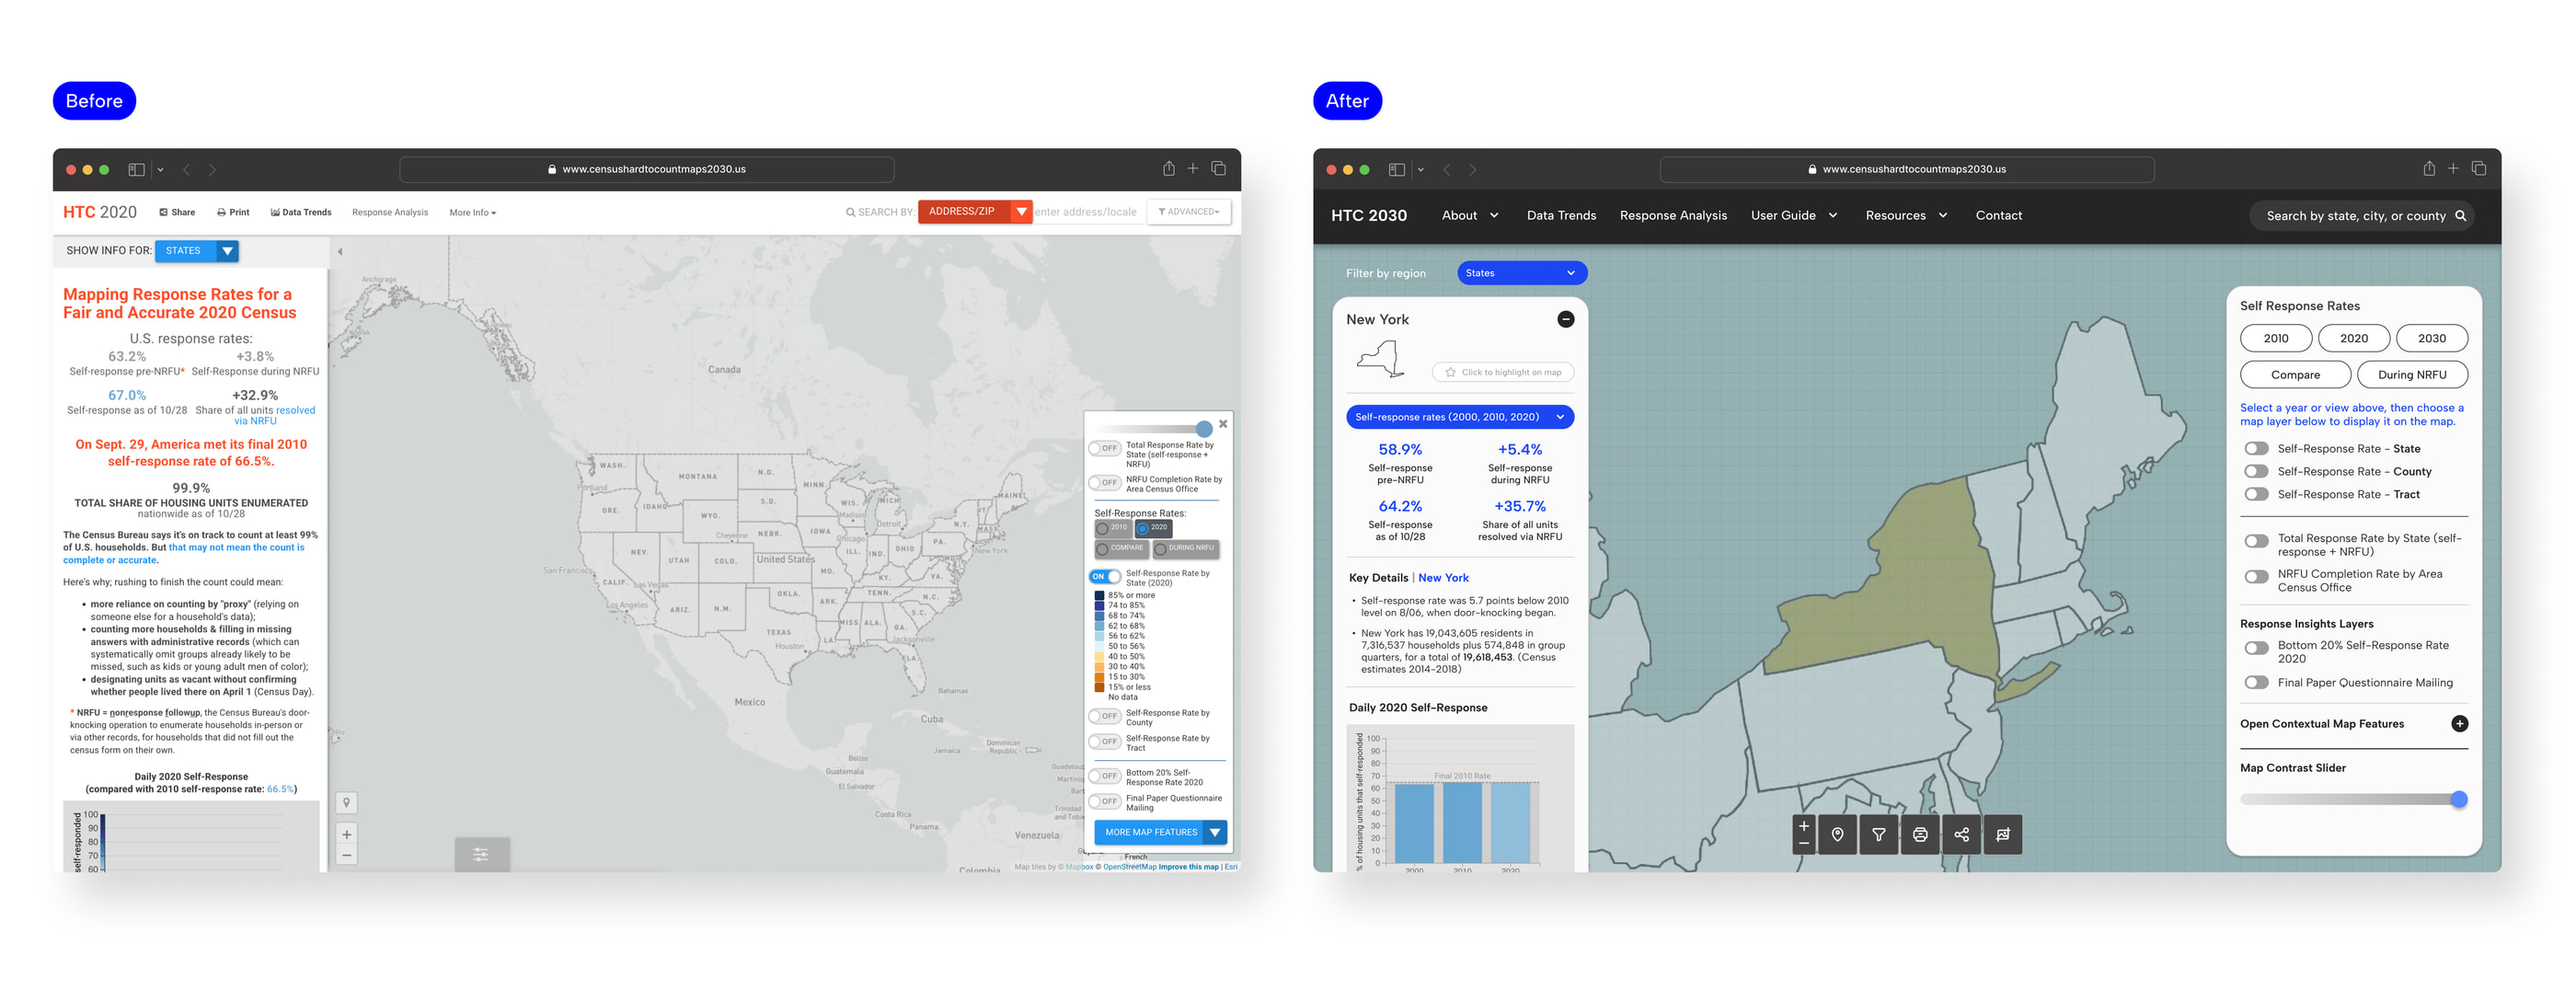
Without the redesign
Multi-layer risk was a workaround. Export and reports lived off-map. Non-GIS partners stalled before the first useful tract.
With the proposed system
Layers, filters, and export live on one workspace. Onboarding and clear IA open the product to funders and organizers, not only GIS specialists.
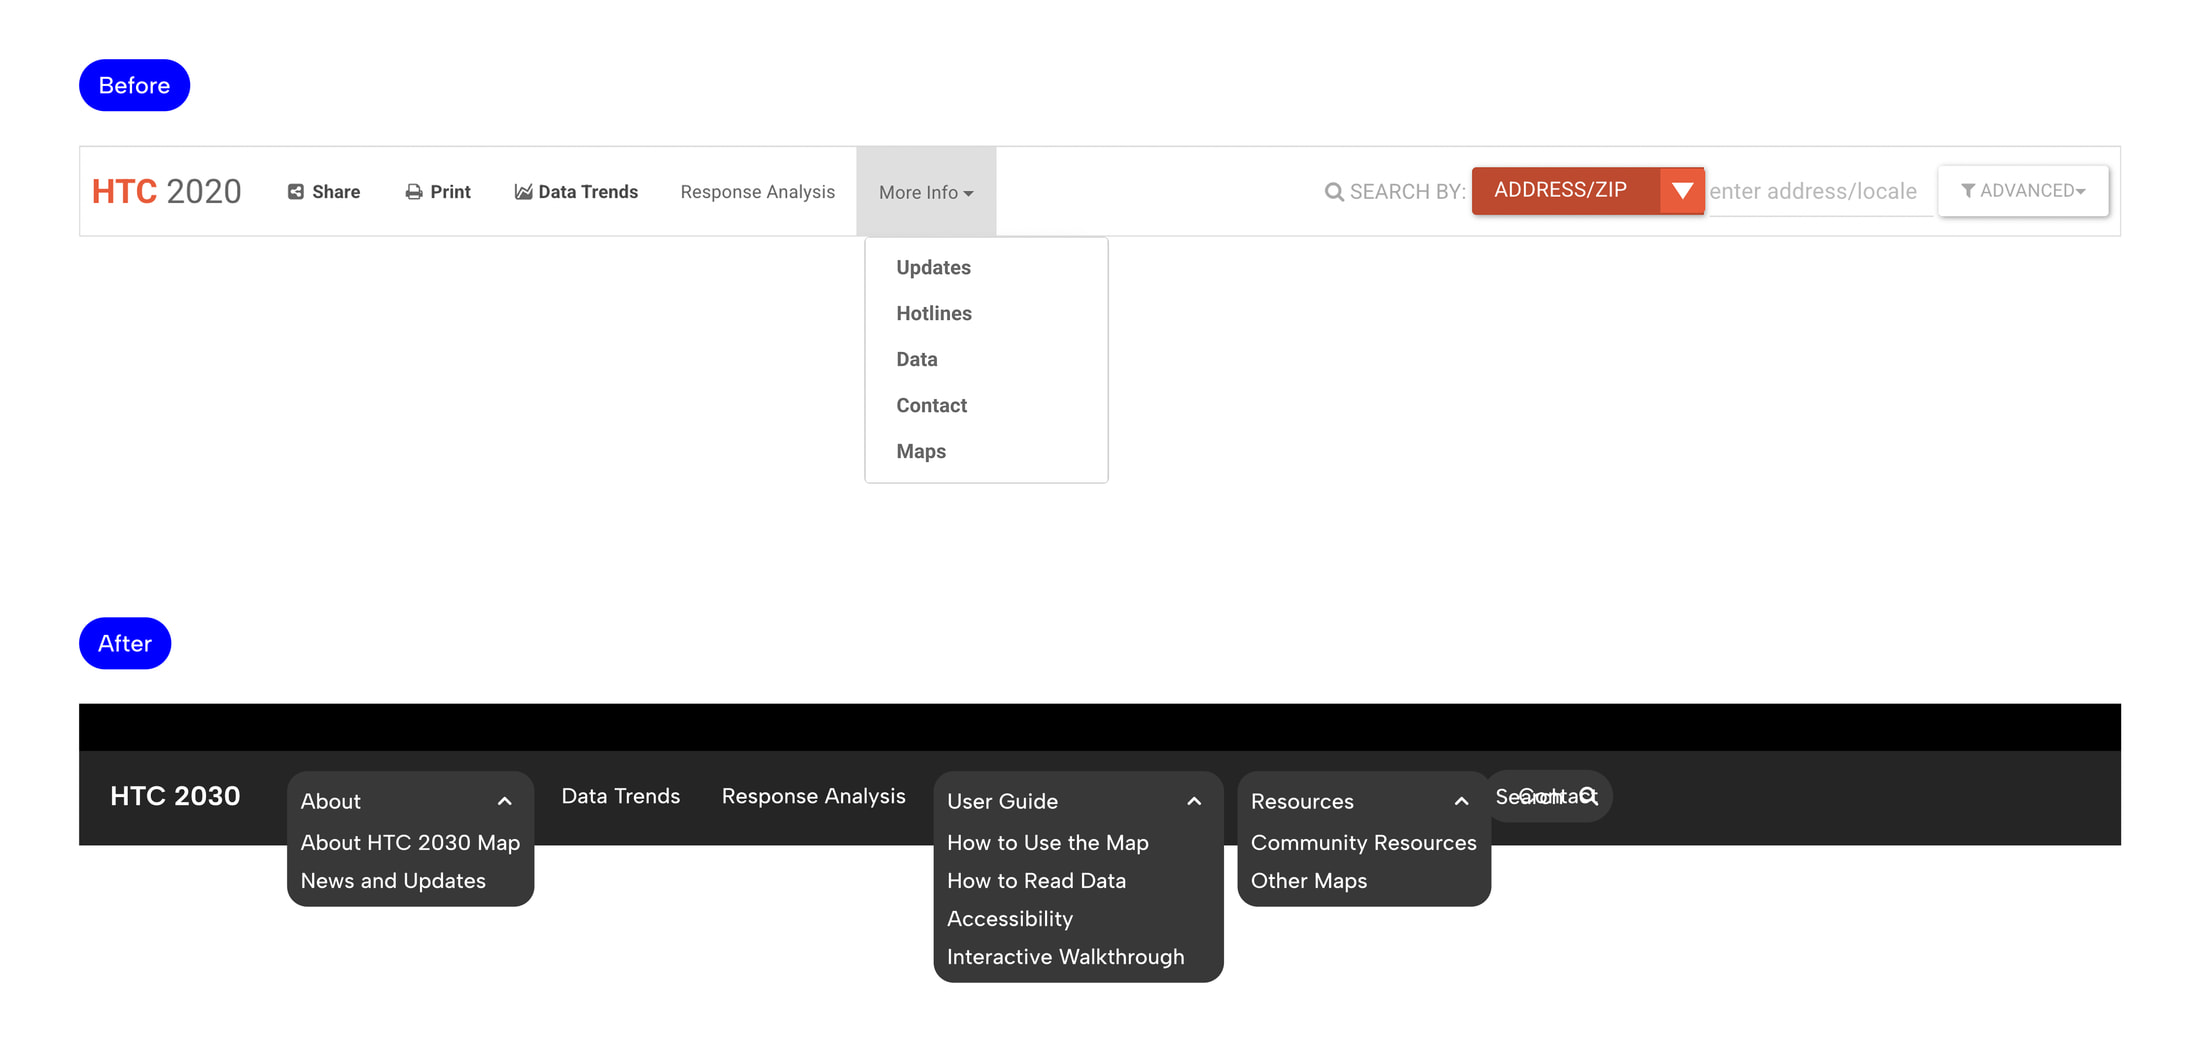
01 · Wayfinding
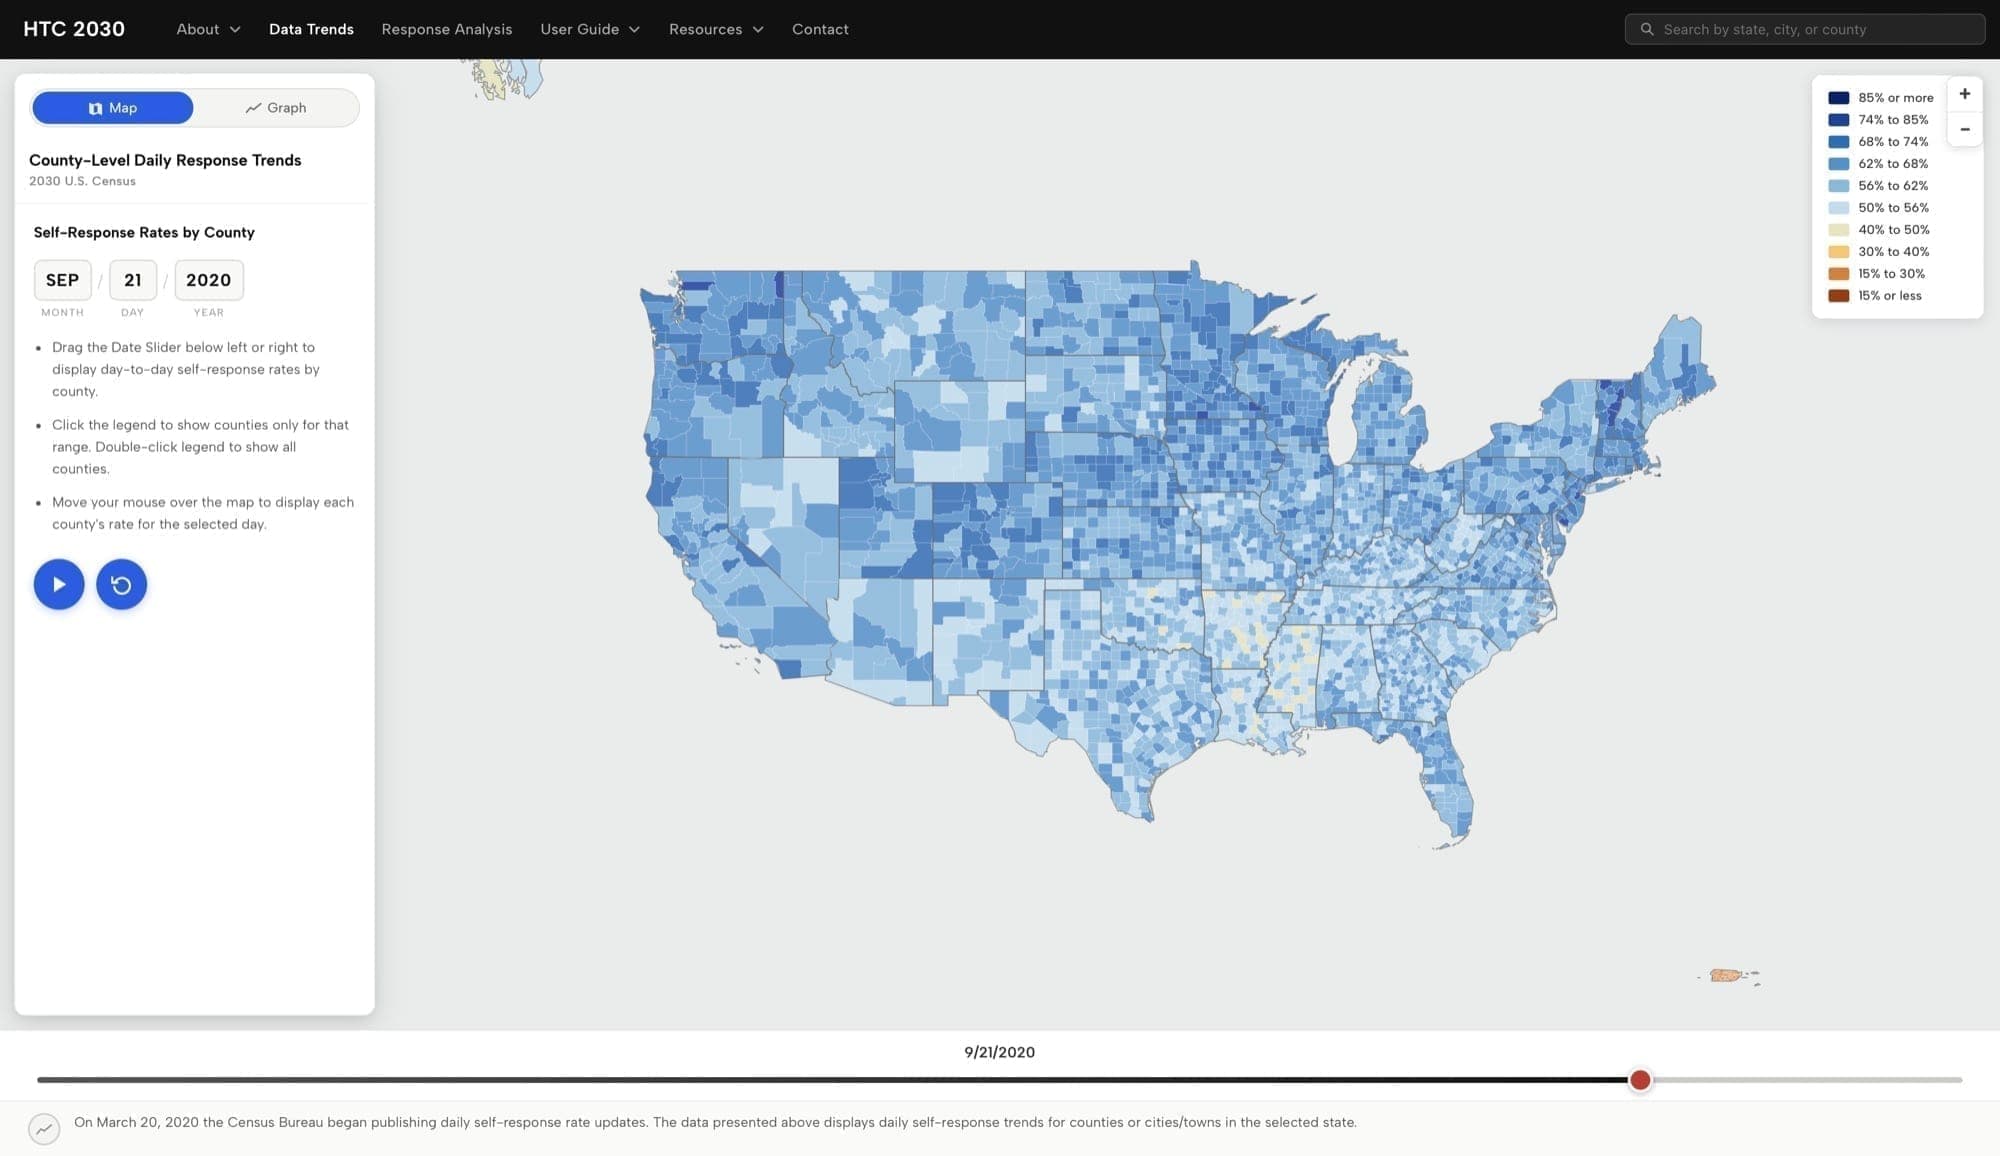
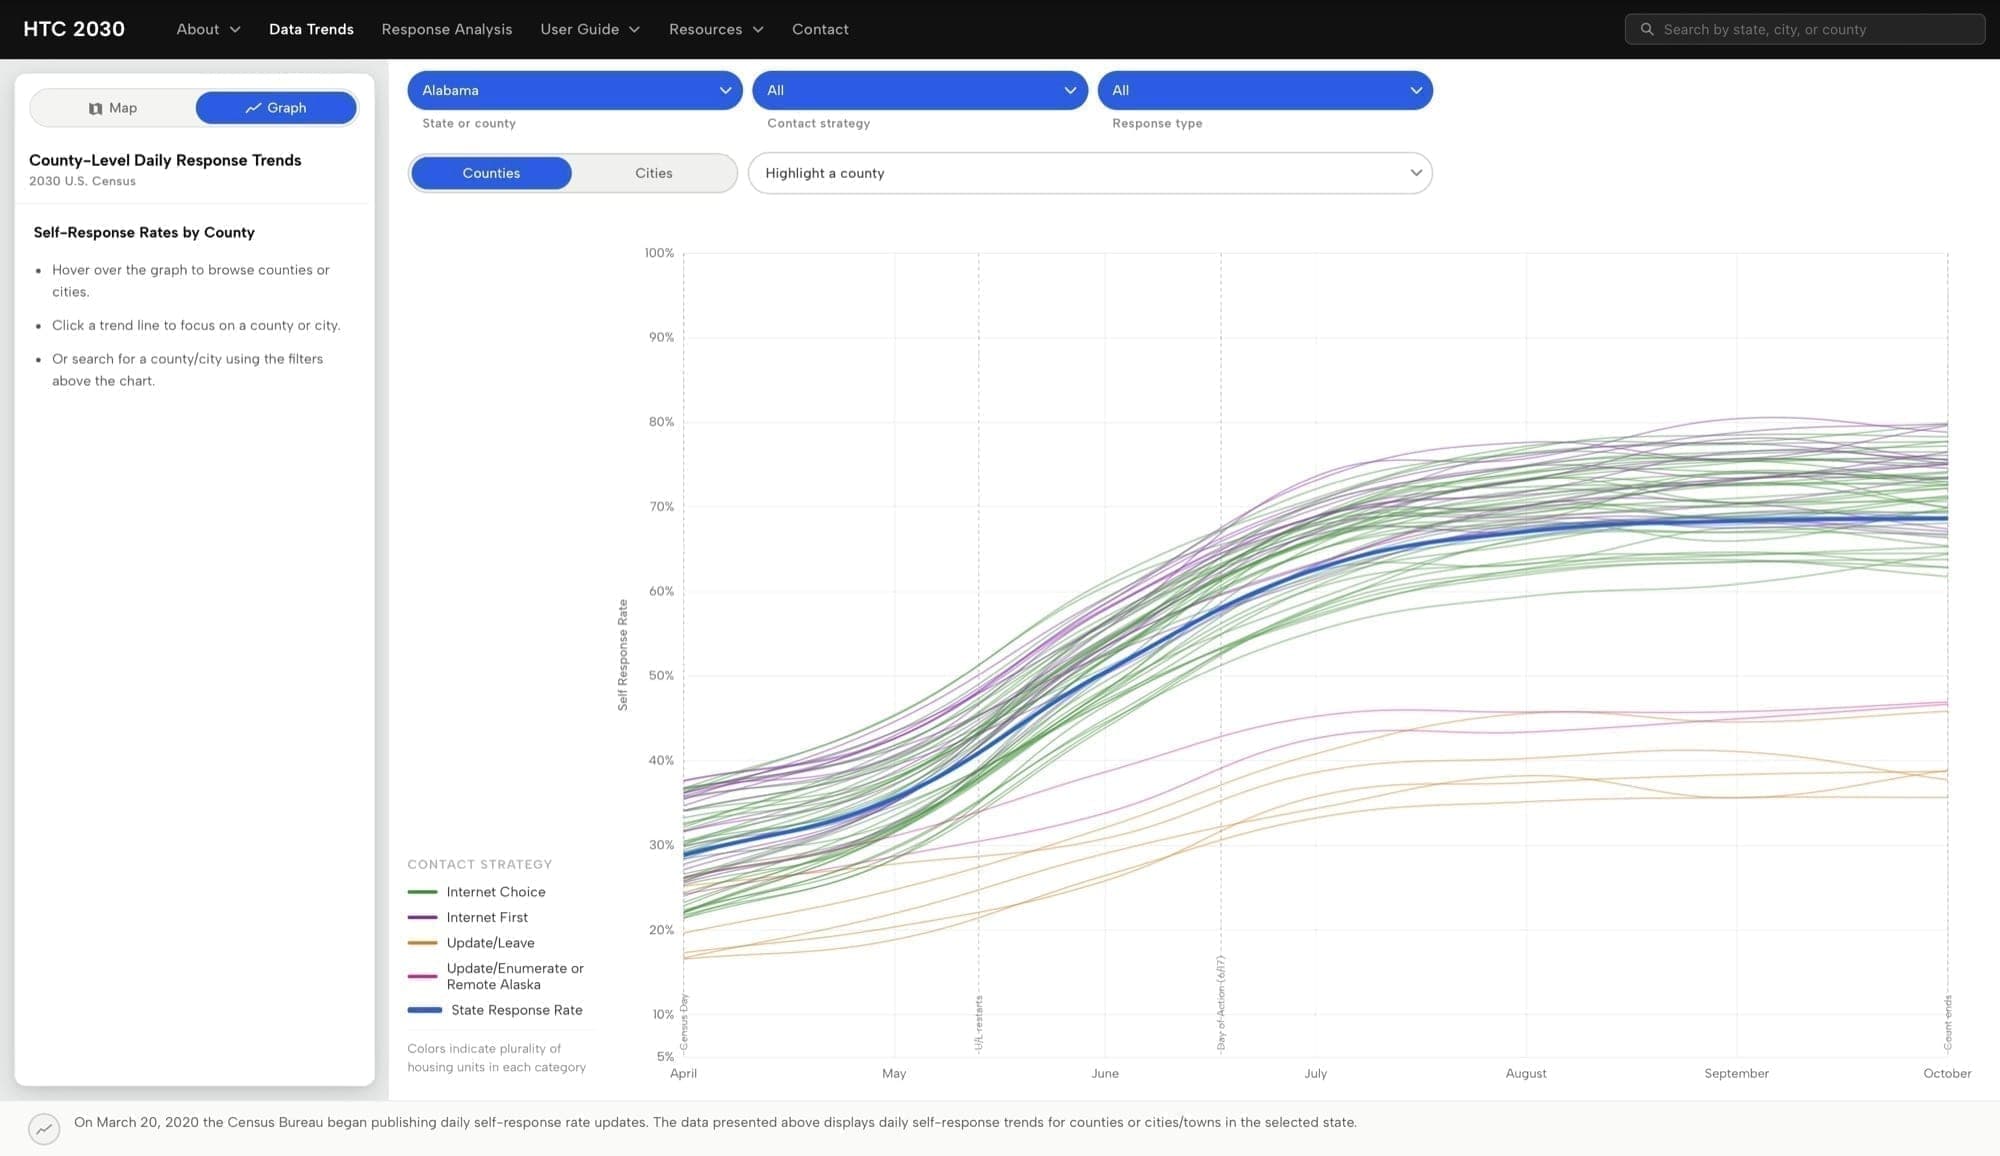
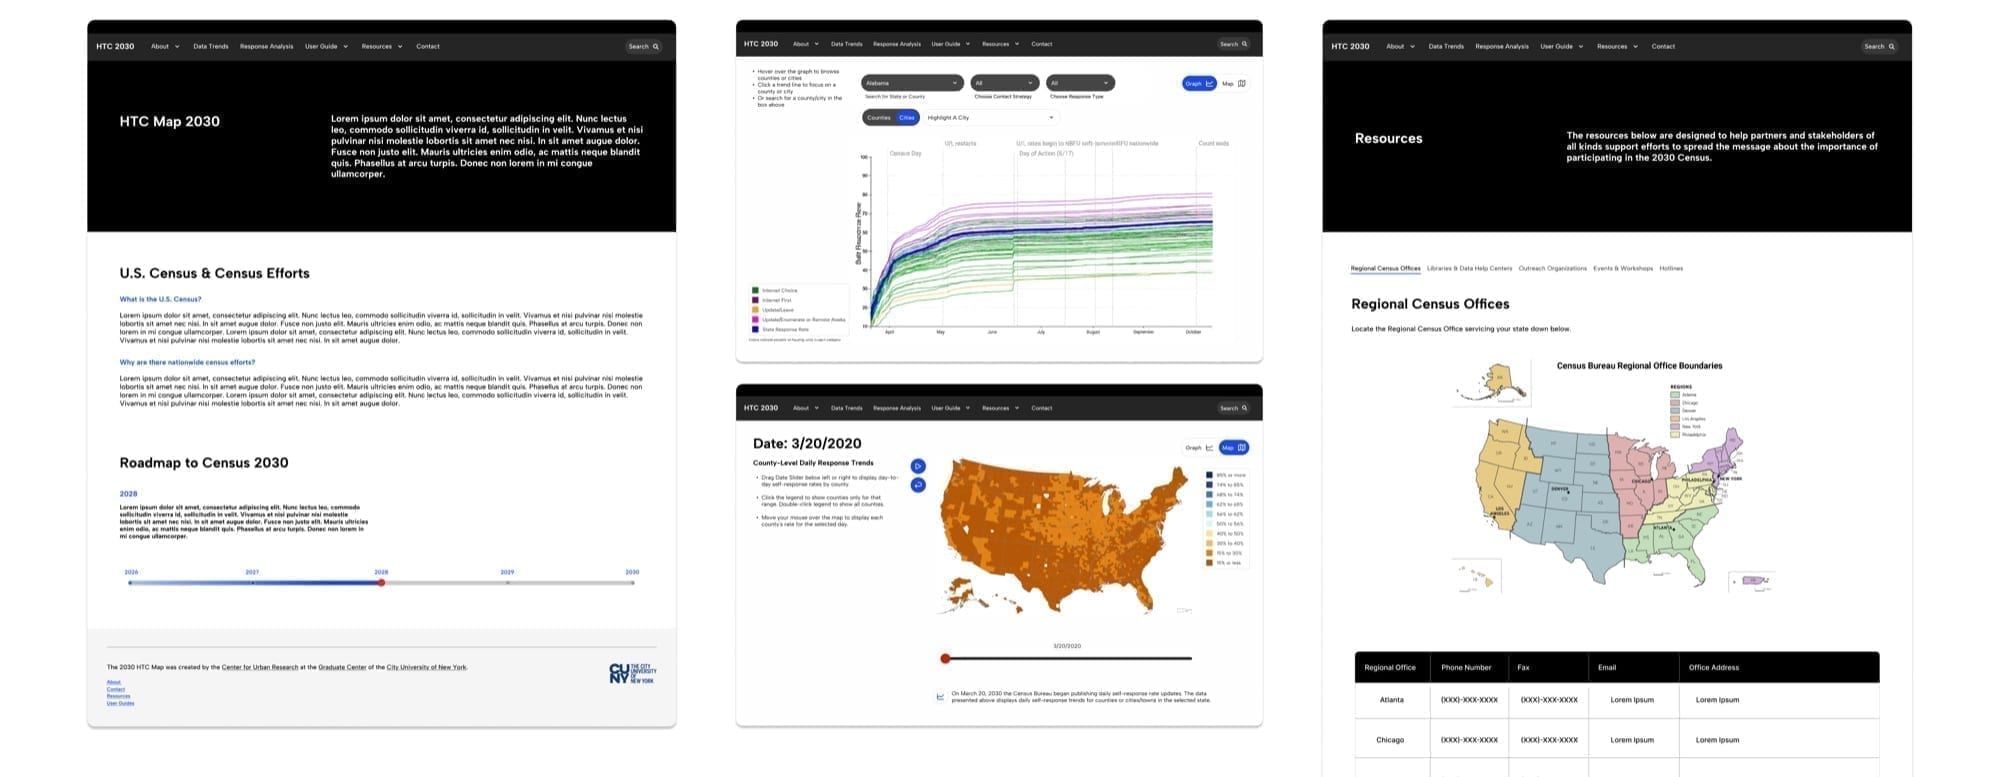
IA that separates work from learning
Critical info was buried. New routes and cleaner map chrome keep discovery open without stripping expert controls.
02 · Primary workspace
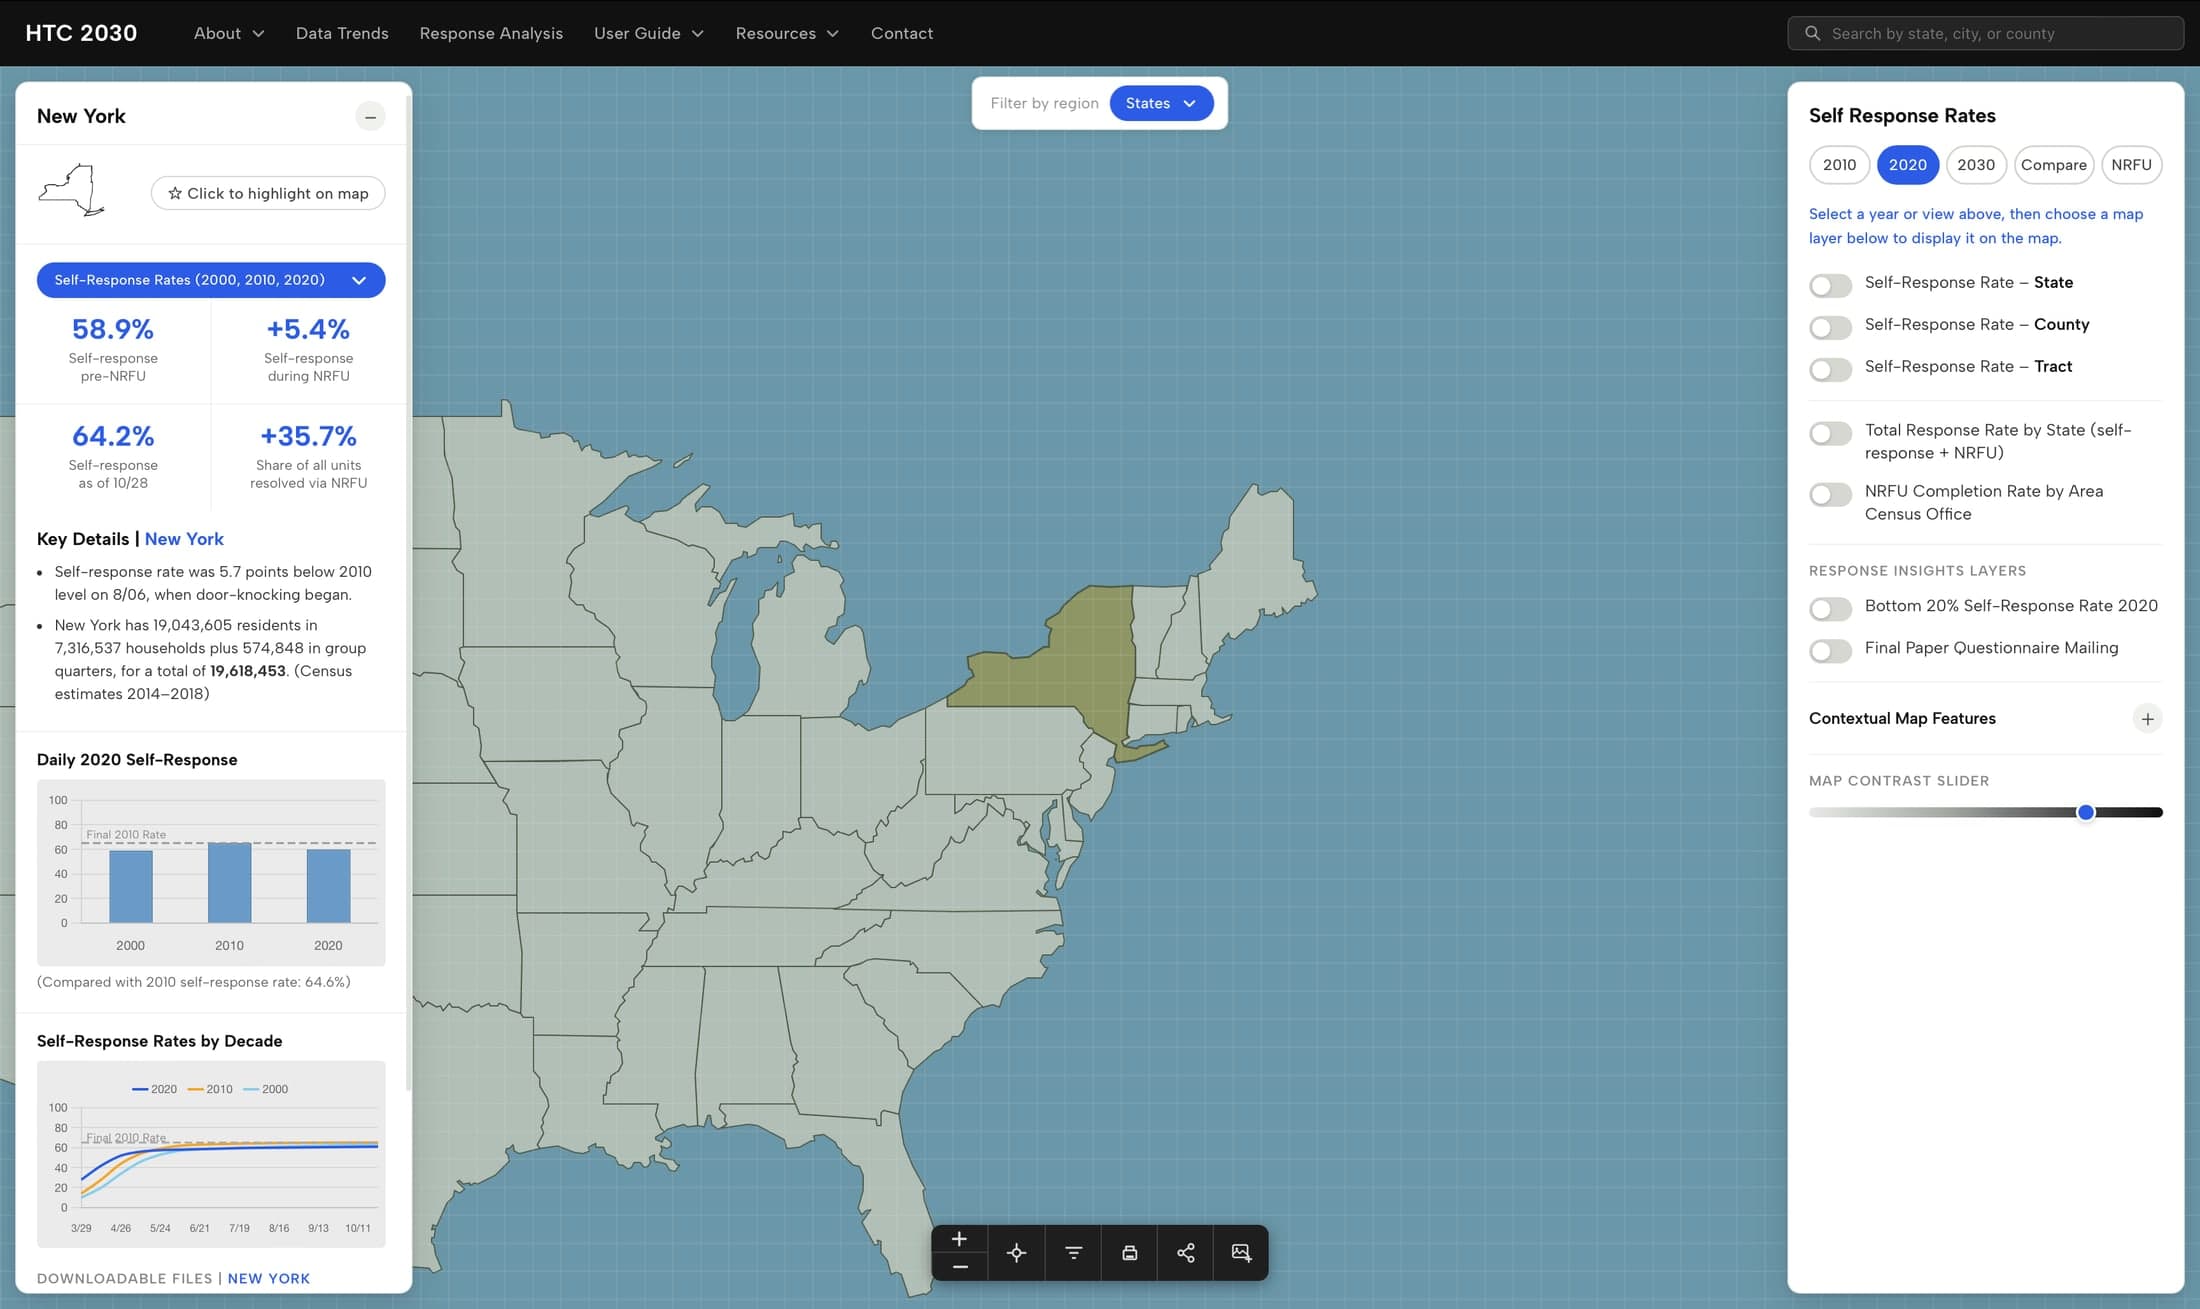
Dashboard as the outreach surface
Daily use lives on the map. Nav, layers, info panel, and export toolbar rebuilt as one high-frequency surface, visually distinct for the new census cycle.
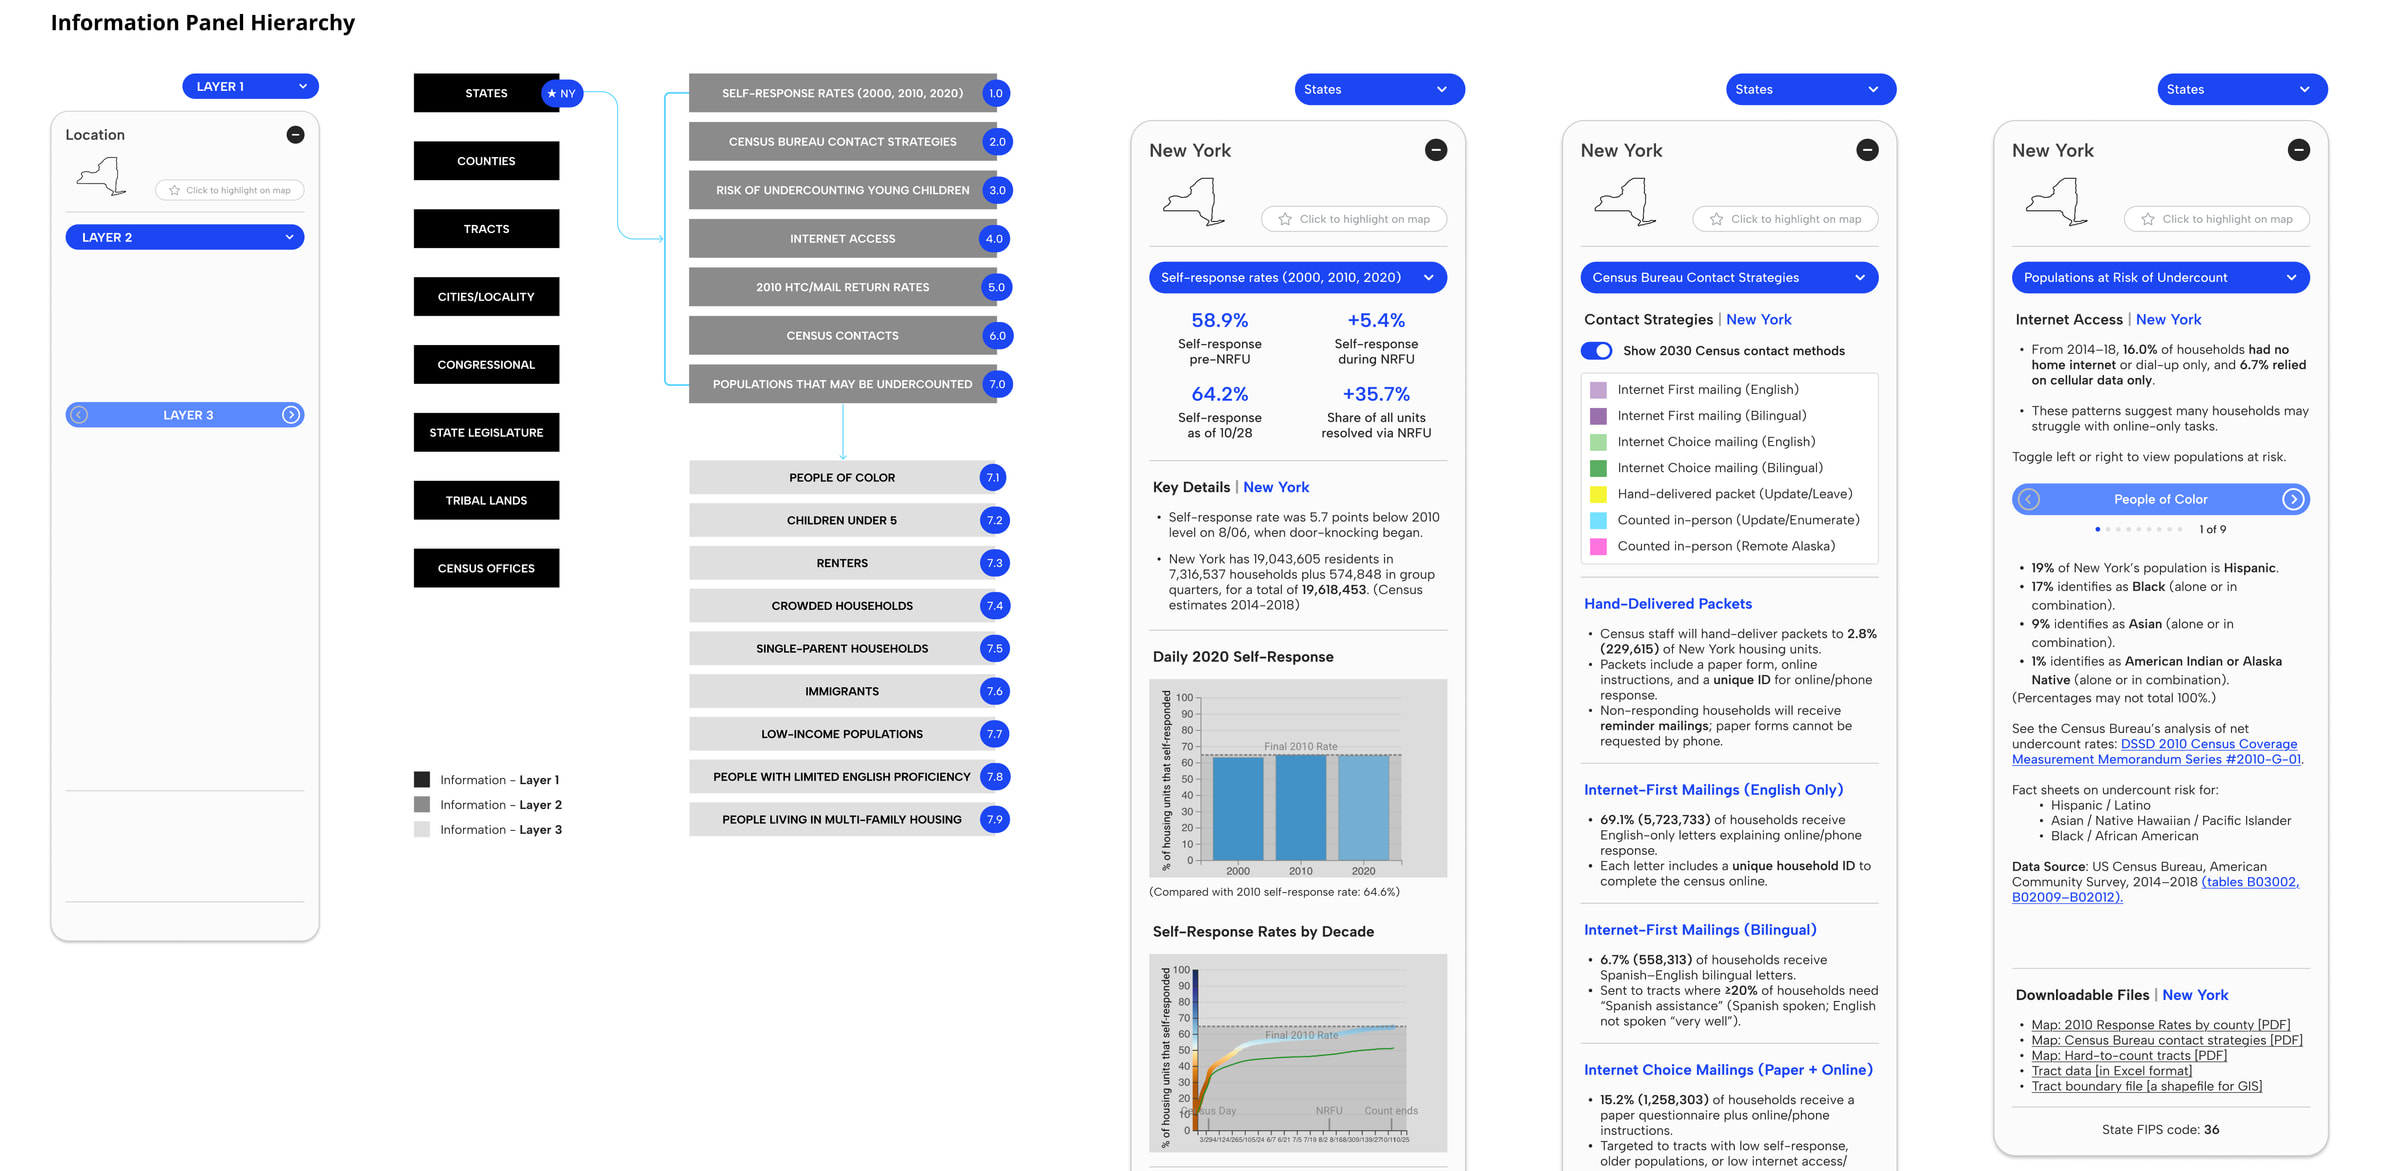
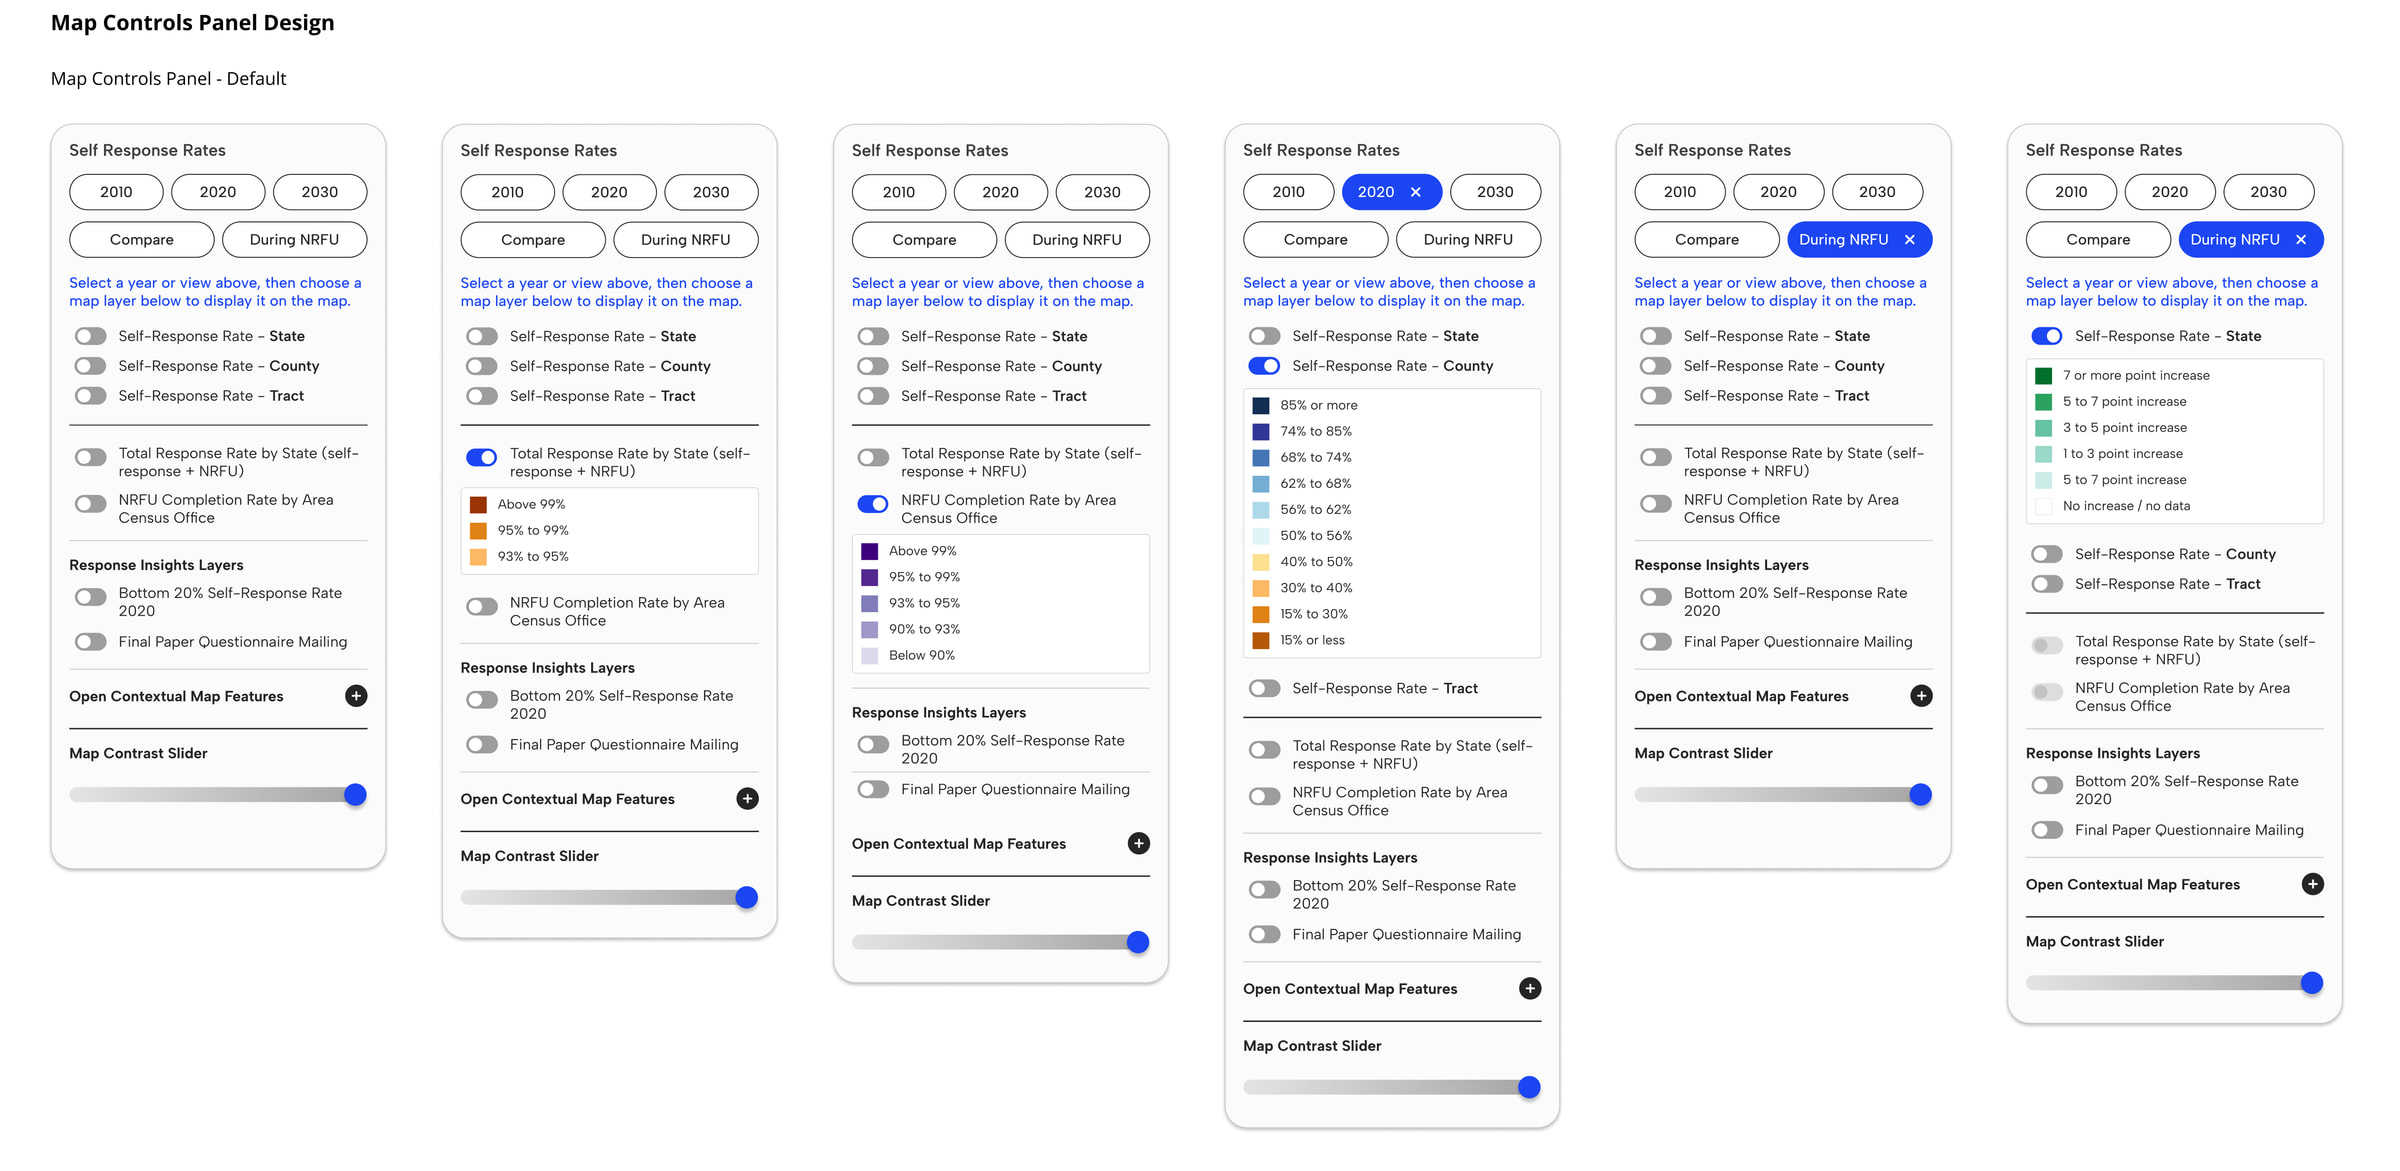
03 · Density with judgment
Info and map control panels
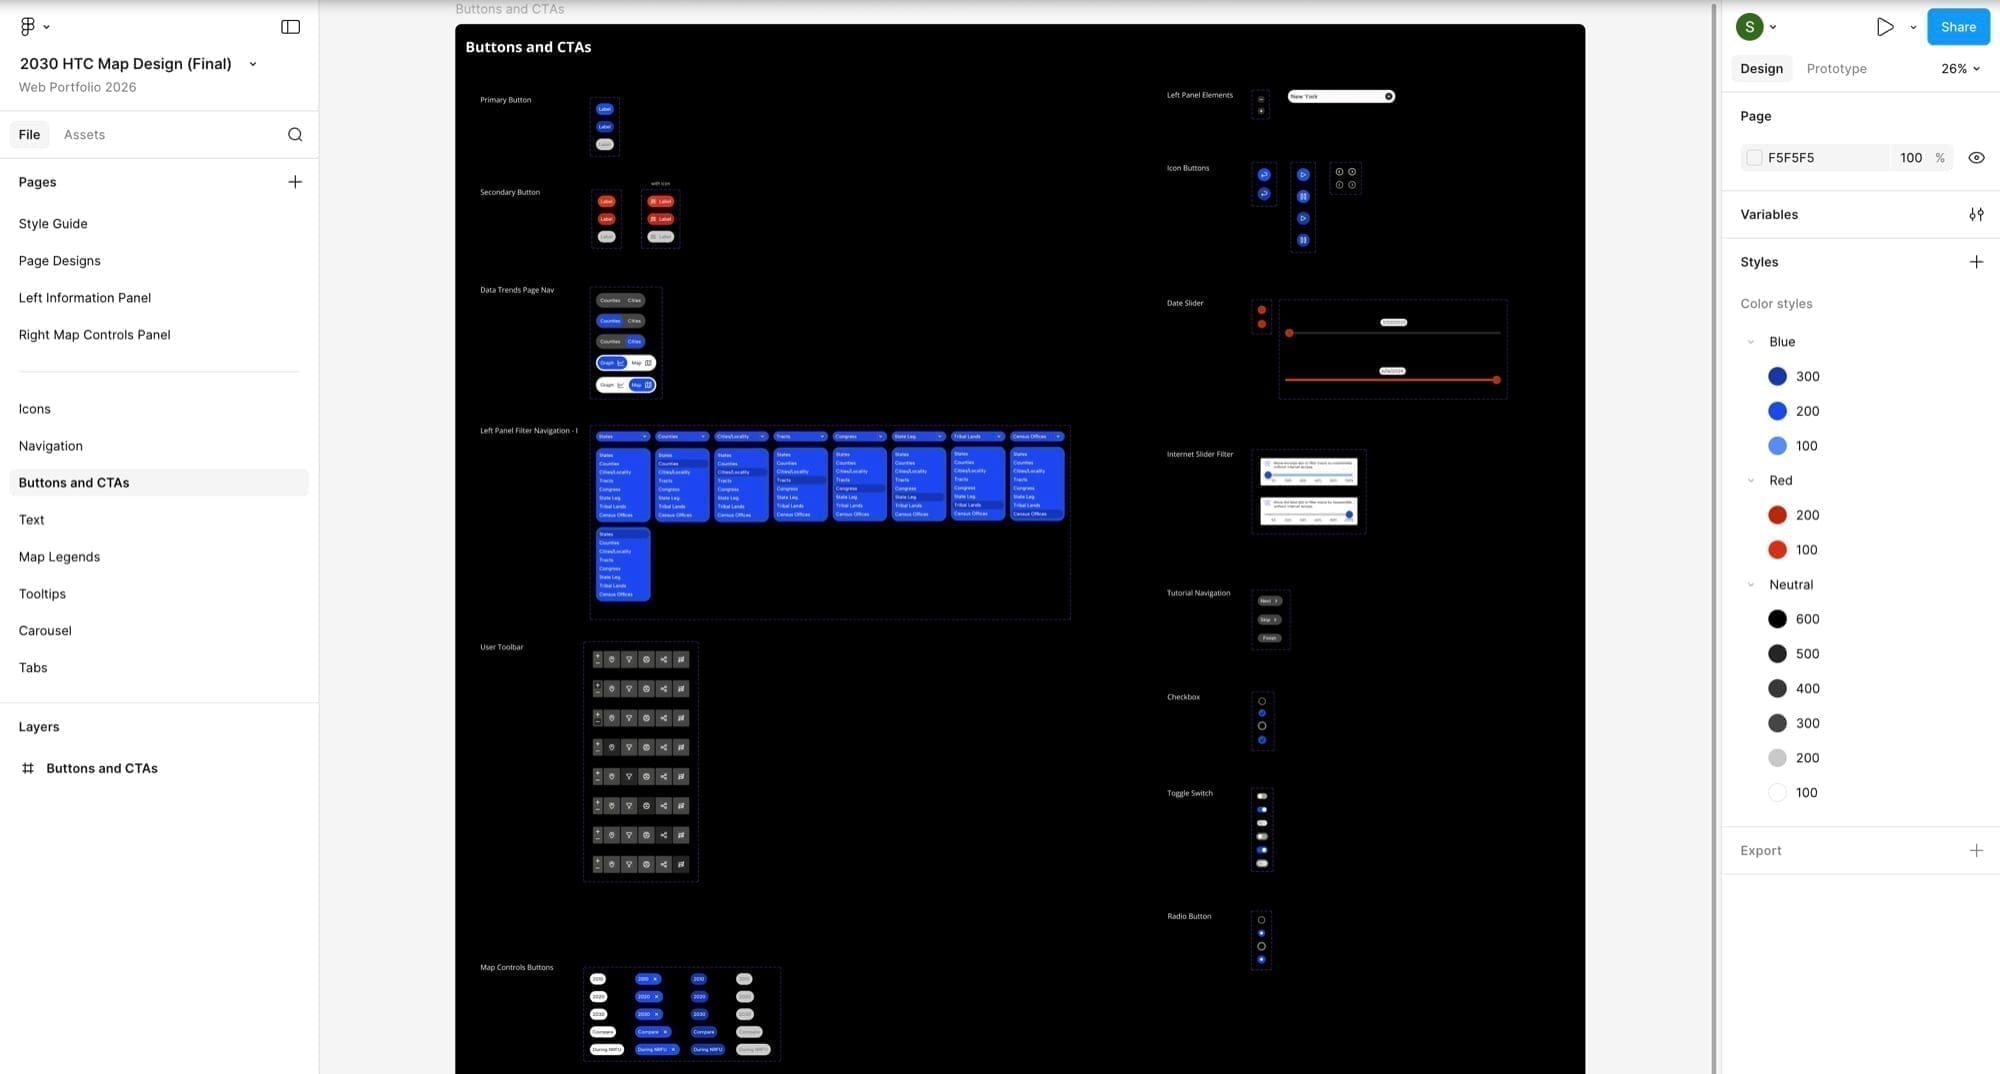
Where census density meets clarity. 26+ states specified so engineering inherits decision logic, not a happy-path mock.
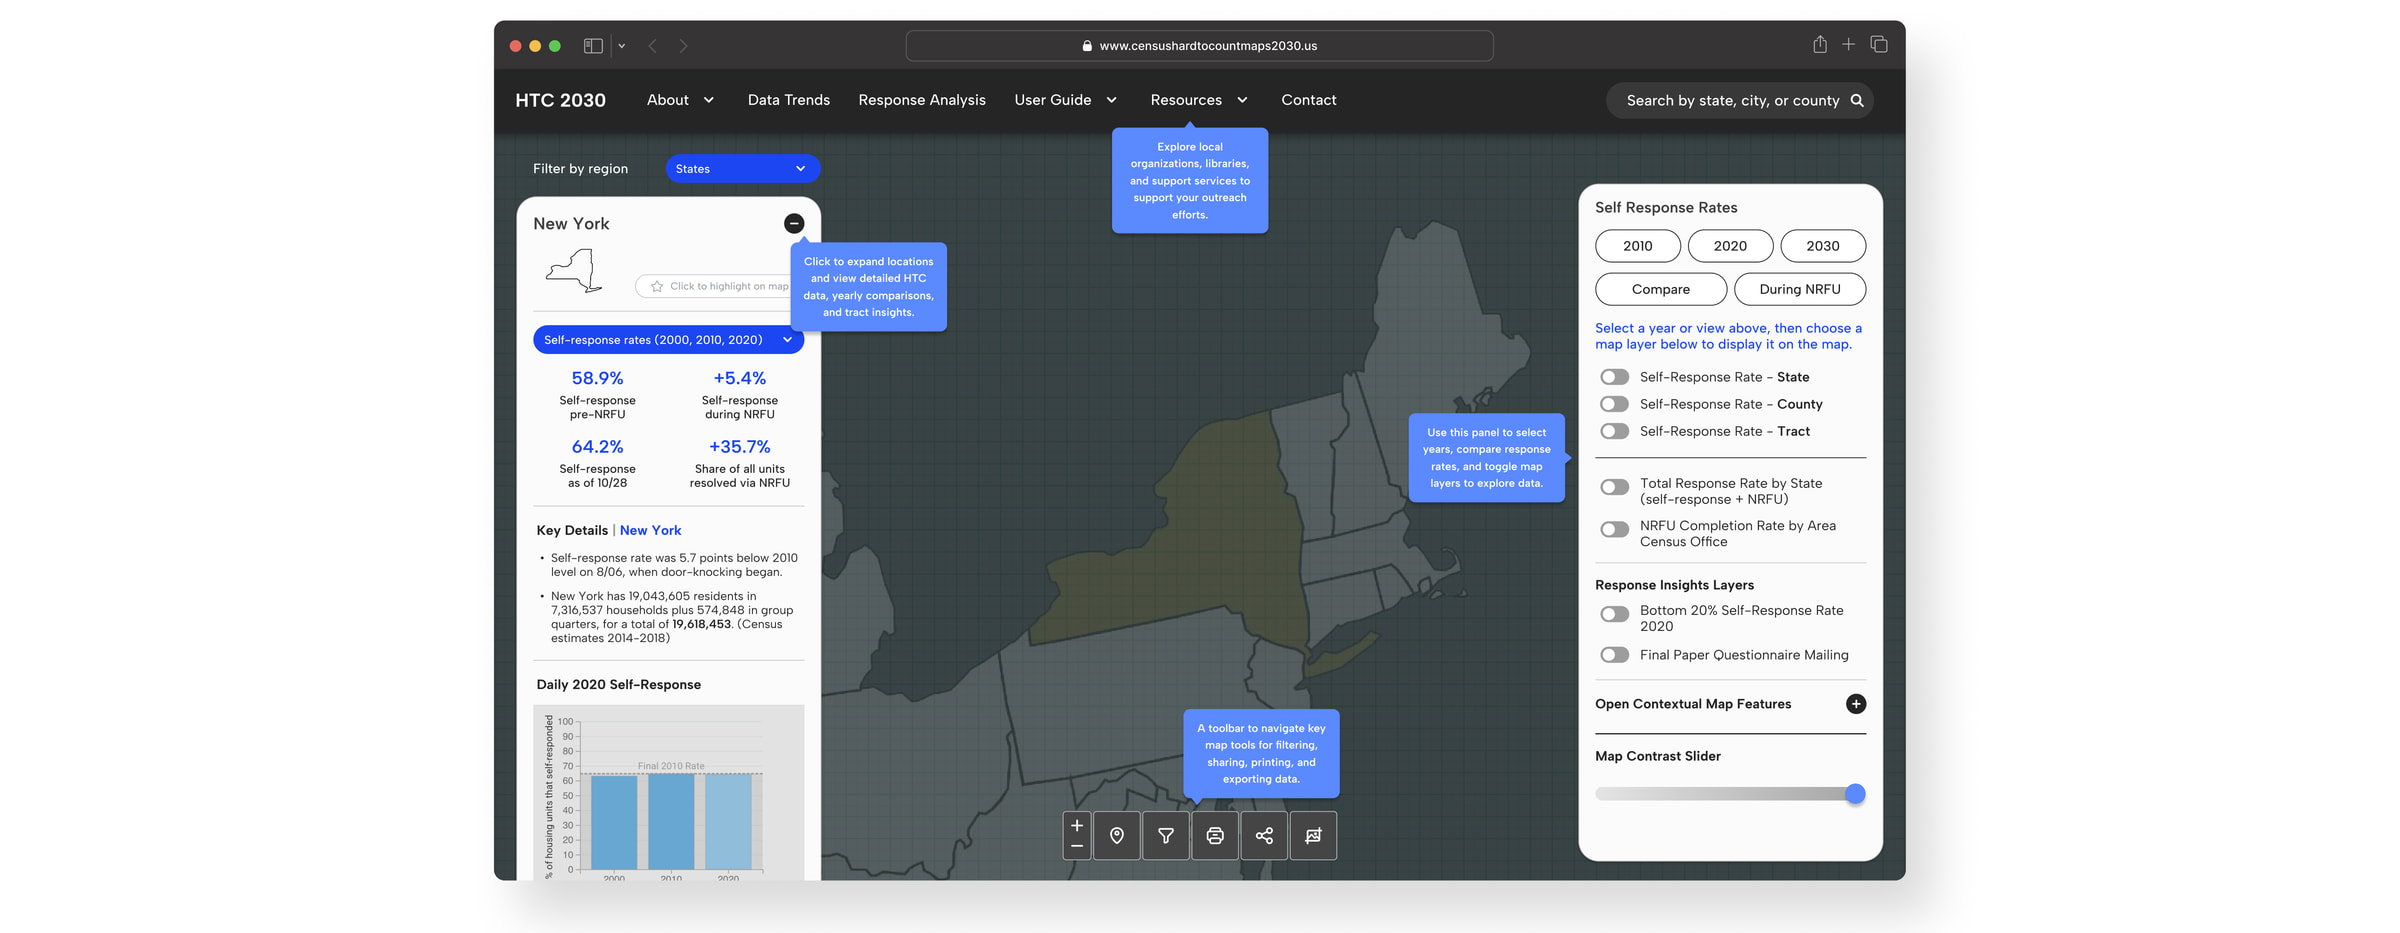
04 · First session
Onboarding and share / export on the map
Complex maps fail first sessions. Tooltips, User Guide, and bottom-pinned print / share / screenshot make handoff part of the product.
Engineering handoff
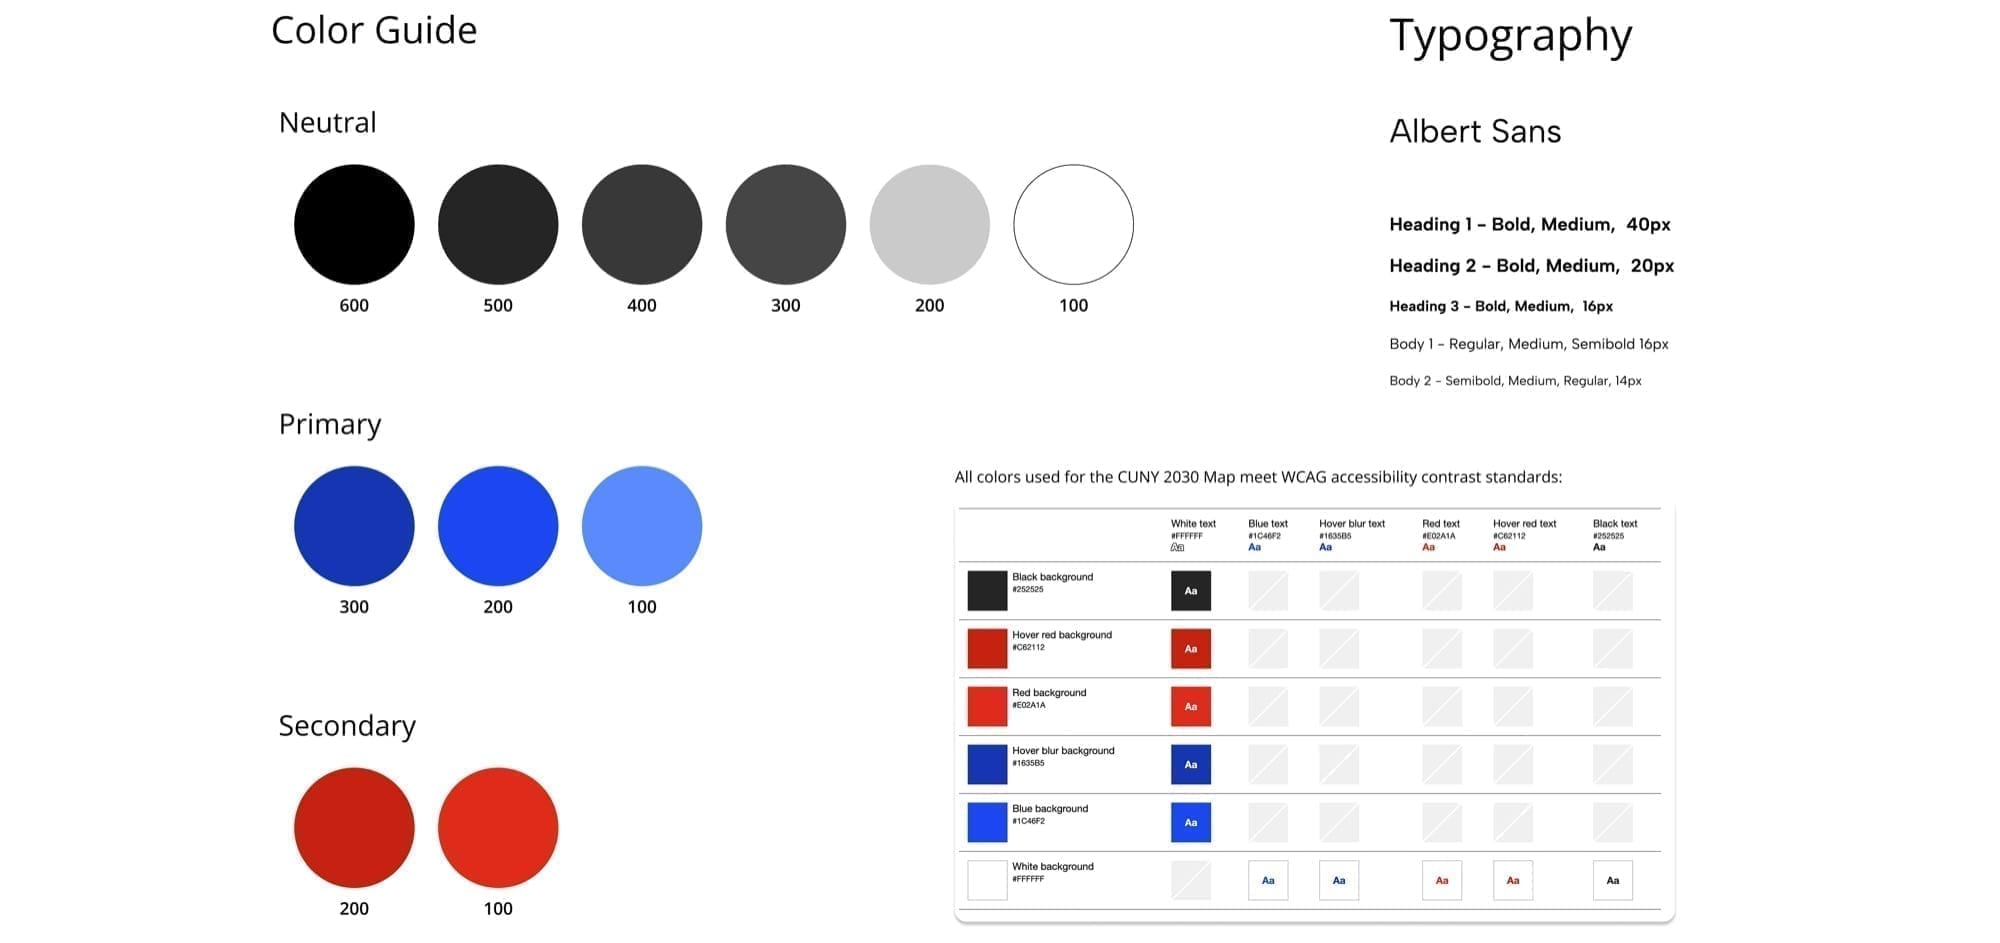
Accessibility locked into the package
CUNY implements. An accessibility-led system put WCAG intent into colors, type, and components rather than a final slide.
Impact
Strategy adoption is the real measure
This engagement delivered product direction rather than a production launch. CUNY Mapping Service said the work exceeded expectations and is using the work to inform the next HTC Map.
Roadmap use
Direction guiding CUNY's next HTC Map build
Implementation-ready
System, IA, scope, and panel states reduce rebuild risk
Protected musts
Layers, export, onboarding, and clear panels stay first
Close
Research-backed product direction for the teams who make the 2030 count more complete.
Tradeoffs
Risks still open after handoff
- 01
Density vs. first session
Layers help experts; they can still overwhelm newcomers. Measure first-session completion for non-GIS roles.
- 02
Shared maps, clear labels
Easier share and print means maps leave the product. Labels need to stay clear so findings aren’t misread once they’re forwarded.
- 03
Build cost of precision
26+ panel states aid handoff but cost capacity. Must-only phases may be the right production plan.